
(T2108 measures the percentage of stocks trading above their respective 40-day moving averages [DMAs]. It helps to identify extremes in market sentiment that are likely to reverse. To learn more about it, see my T2108 Resource Page. You can follow real-time T2108 commentary on twitter using the #T2108 hashtag. T2108-related trades and other trades are posted on twitter using the #120trade hashtag)
T2108 Status: 45.9% (20.4% increase)
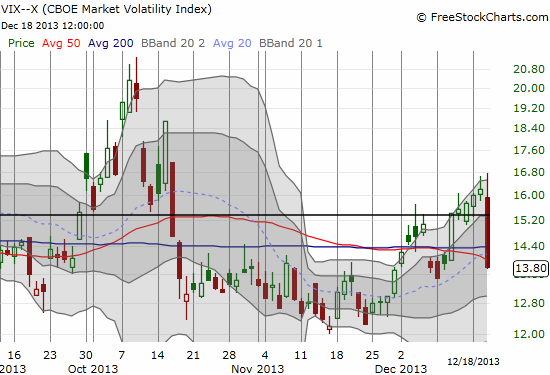
VIX Status: 13.8 (14.9% drop)
General (Short-term) Trading Call: Aggressive traders still experiencing whiplash around the 1800 pivot. Overall bias switches to bullish and will stay there unless/until market reverses all its post-Fed gains.
Active T2108 periods: Day #116 over 20% (overperiod), Day #12 under 50%, Day #29 under 60%, Day #34 under 70%
Reference Charts (click for view of last 6 months from Stockcharts.com):
S&P 500 or SPY
SDS (ProShares UltraShort S&P500)
U.S. Dollar Index (volatility index)
EEM (iShares MSCI Emerging Markets)
VIX (volatility index)
VXX (iPath S&P 500 VIX Short-Term Futures ETN)
EWG (iShares MSCI Germany Index Fund)
CAT (Caterpillar)
Commentary
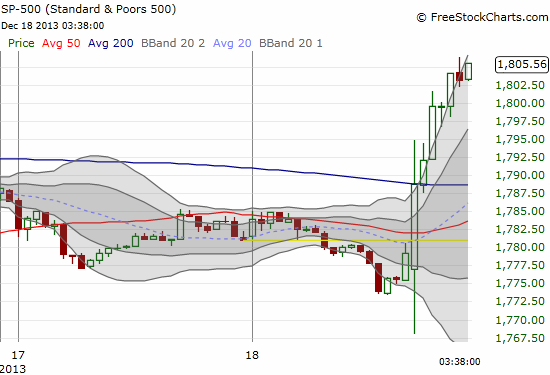
The S&P 500 (SPY) is above 1800 yet again in dramatic fashion. The index closed the day at a marginal new all-time high with a 1.7% gain. All the gains came after the Federal Reserve announced a tease of a taper by shaving a little “edge” off its bond buying program and promising to keep rates low for what now almost seems like an eternity. It reads like a sample-sized tapering: just enough to signal to the markets a change in direction, but not enough to have any real impact on anything. The market was a bit indecisive in the wake of the announcement as the index first dipped to its 50DMA before shooting upward like a rocket.
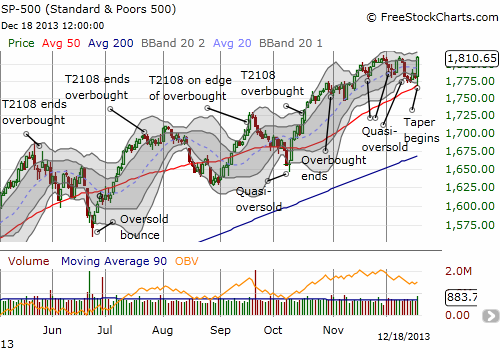
This looks like upside resolution all over again. The bias flips right back to the upside especially with T2108 putting on a strong showing from what were another set of quasi-oversold conditions. Note that the T2108 Trading Model (TTM) accurately anticipated another day of selling after the quasi-oversold conditions were met. However, looking back, we find ourselves with yet another resounding example of the power of quasi-oversold conditions in an uptrend: an eventual recovery, often sharp, from the previous selling. At this point, I am not even sure what it will take for this market to drop to TRUE oversold conditions (T2108 at or below 20%)! T2108 was last oversold in June – 116 trading days ago (the 20% overperiod).
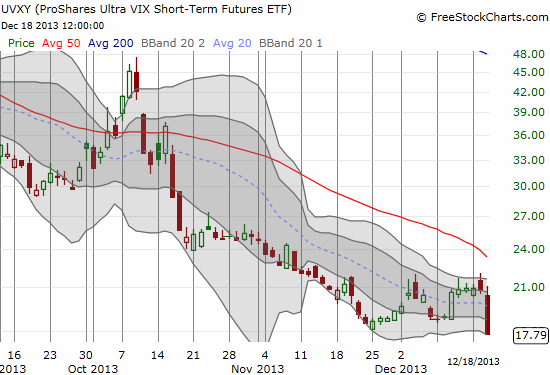
While I was VERY surprised by the strength of the market post-Fed, I was not surprised by the collapse in volatility in the wake of the Fed. As I mentioned in the last T2108 Update, I bought puts on ProShares Ultra VIX Short-Term Futures ETF (UVXY) in anticipation of an implosion in volatility leading into or in the immediate wake of the Fed announcement. Given the strong move in the S&P 500, I decided to hold the puts instead of selling them immediately as I originally planned. Assuming the market follows through in the coming week or two, volatility will go even lower from here and UVXY will suffer mightily. The VIX plunged 14.9%, and UVXY fell by a similar amount.
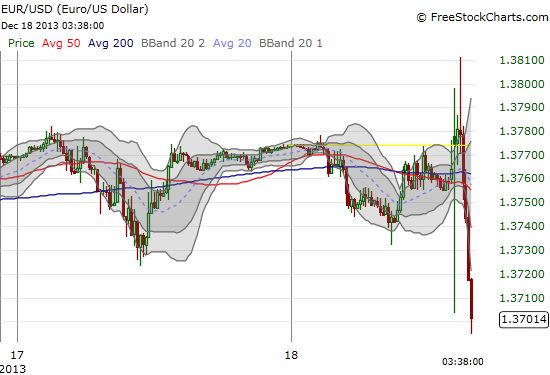
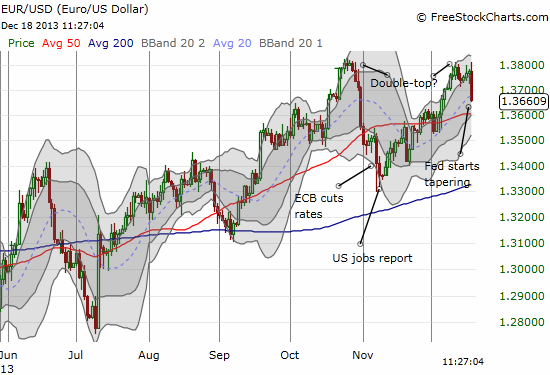
The impact in foreign exchange was equally dramatic on an intraday basis. The fireworks were enhanced by a very strong employment report from the United Kingdom overnight. I will have to dedicate an entire post to the intriguing forex implications of this post-taper era. I will just say for now that I have an intense focus on the euro (FXE) right now as I consider it incredibly over-valued. It has been beating up on almost all major currencies in recent weeks and even months. In particular, its out-performance against the U.S. dollar and the British pound is long overdue for a major rollback. Note that the euro is still above its level after the ECB CUT rates in early November…
Daily T2108 vs the S&P 500
")
Black line: T2108 (measured on the right); Green line: S&P 500 (for comparative purposes)
Red line: T2108 Overbought (70%); Blue line: T2108 Oversold (20%)
Weekly T2108

*All charts created using freestockcharts.com unless otherwise stated
Related links:
The T2108 Resource Page
Expanded daily chart of T2108 versus the S&P 500
Expanded weekly chart of T2108
Be careful out there!
Full disclosure: long SSO puts and calls, long UVXY puts, long shares in SPHB, SPLV, and VXX; net short euro, net long pound, net long U.S. dollar