
(T2108 measures the percentage of stocks trading above their respective 40-day moving averages [DMAs]. It helps to identify extremes in market sentiment that are highly gap down to reverse. To learn more about it, see my T2108 Resource Page. You can follow real-time T2108 commentary on twitter using the #T2108 hashtag. T2108-related trades and other trades are posted on twitter using the #120trade hashtag)
T2108 Status: 46.5%
VIX Status: 14.5 (broke down again below pivot)
General (Short-term) Trading Call: Hold. Aggressive traders should have already bought the breakout above the 50DMA.
Active T2108 periods: Day #52 over 20% (overperiod), Day #18 under 50%, Day #76 under 70%
Reference Charts (click for view of last 6 months from Stockcharts.com):
S&P 500 or SPY
SDS (ProShares UltraShort S&P500)
U.S. Dollar Index (volatility index)
VIX (volatility index)
VXX (iPath S&P 500 VIX Short-Term Futures ETN)
EWG (iShares MSCI Germany Index Fund)
CAT (Caterpillar)
Commentary
Looks like the market is done threatening us with a correction. As noted in the last T2108 update, the various T2108 indicators were lining up as if the market was ready to run again. Monday’s breakout and Tuesday’s confirmation seem to have the arrows all pointing northward.
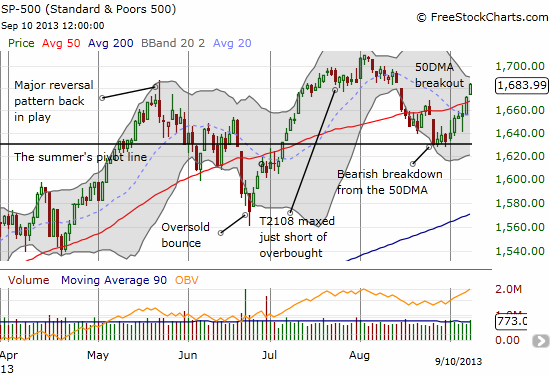
The one small remaining caveat is that the former all-time high and ominous reversal from late May remains in play as potential resistance. If the S&P 500 turns cold here and turns around, suddenly we have the much dreaded head and shoulders technical pattern. Stay tuned on that one.
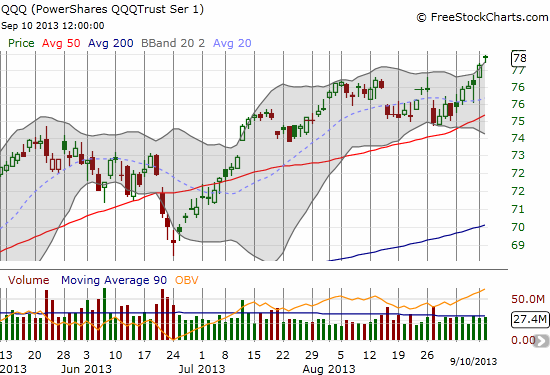
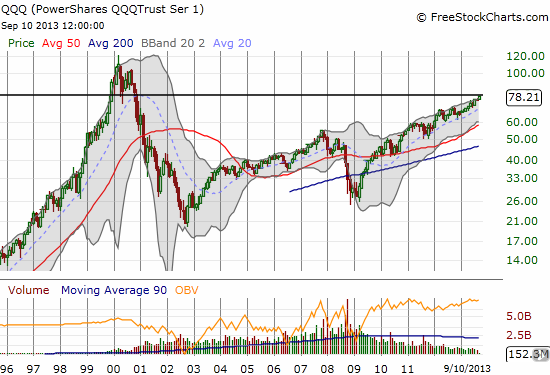
In the meantime, the most gratifying part of this move is that the PowerShares QQQ (QQQ) reached a new roughly 13-year high. My call options are suddenly over 50% in the money. Patience paid off.
My ProShares Ultra S&P500 (SSO) call options are almost back to even. With hindsight, they were really hurt by my reluctance to add a third tranche as the S&P 500 approached oversold. I have no regrets since I stuck my rules. But, yes, I was REALLY looking forward to load up all over again in oversold conditions!
I will continue to stubbornly hold onto my call options, hopefully through the end of this week at least.
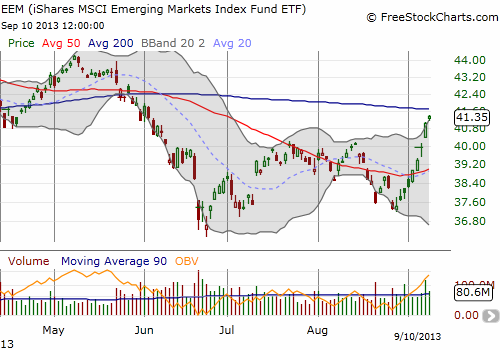
Even the iShares MSCI Emerging Markets ETF (EEM) has caught the breakout bug. My hedge using EEM puts of course has blown up, but I started a fresh tranche of October puts as EEM now approaches what should be stiffer resistance at the downward trending 200DMA.
Daily T2108 vs the S&P 500
")
Black line: T2108 (measured on the right); Green line: S&P 500 (for comparative purposes)
Red line: T2108 Overbought (70%); Blue line: T2108 Oversold (20%)
Weekly T2108

*All charts created using freestockcharts.com unless otherwise stated
Related links:
The T2108 Resource Page
Expanded daily chart of T2108 versus the S&P 500
Expanded weekly chart of T2108
Be careful out there!
Full disclosure: long SSO and QQQ calls; long EEM puts