
(T2108 measures the percentage of stocks trading above their respective 40-day moving averages [DMAs]. It helps to identify extremes in market sentiment that are highly gap down to reverse. To learn more about it, see my T2108 Resource Page. You can follow real-time T2108 commentary on twitter using the #T2108 hashtag. T2108-related trades and other trades are posted on twitter using the #120trade hashtag)
T2108 Status: 32.9%
VIX Status: 15.9 (surprisingly flat)
General (Short-term) Trading Call: Hold. Get ready for buying into oversold conditions.
Active T2108 periods: Day #50 over 20% (overperiod), Day #14 under 40%, Day #74 under 70%
Reference Charts (click for view of last 6 months from Stockcharts.com):
S&P 500 or SPY
SDS (ProShares UltraShort S&P500)
U.S. Dollar Index (volatility index)
VIX (volatility index)
VXX (iPath S&P 500 VIX Short-Term Futures ETN)
EWG (iShares MSCI Germany Index Fund)
CAT (Caterpillar)
Commentary
The S&P 500 (SPY) looks like a market that wants to go up. Friday was supposed to be a pivotal day with the August jobs numbers providing the market definitive guidance on the Federal Reserve’s tapering plans. Instead, the S&P 500 opened flat with the previous day, dipped sharply on some new old news about Syria (Russia is insisting on challenging the U.S. here), and then rallied sharply before pulling back from 50DMA resistance. It was about as neutral as you can get with the S&P 500 closing up by.09 of a point!
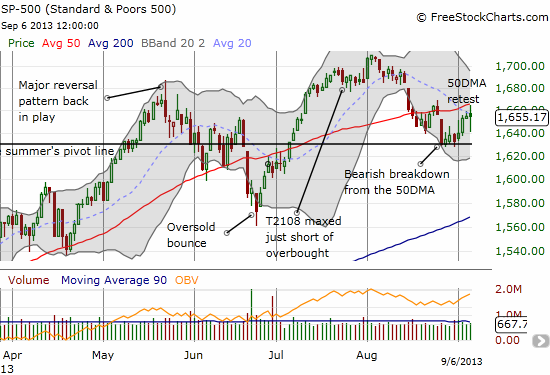
With T2108 in recovery mode and the S&P 500 remaining resilient, I see this market as one that wants to go up. Just remove one of any number of overhangs, and I think the index is off to the races again. The current retest of the 50DMA line of resistance is just the start.
I have not examined the over/under-period charts from the T2108 Trading Model (TTM) in a long time. Time to see what guidance I can gleam from them here….of course with the major caveat that geo-political and soon Fed headlines will likely trump any and all technicals in the immediate aftermath of those headlines.
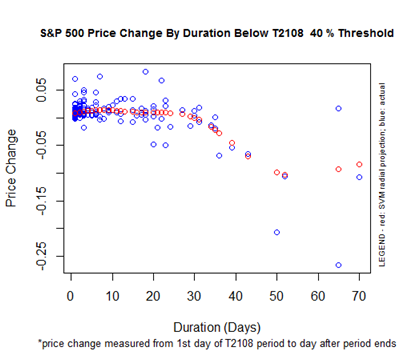
T2108 has spent almost 3 trading weeks under 40%. It is still another three trading weeks away from inheriting a significant downward bias due to the prediction of negative performance for the S&P 500 by the time T2108 gets above 40% again. Until then, the S&P 500 has a slight positive bias. The S&P 500 is currently exactly flat with where it closed on August 16th, the day T2108 closed under 40% and the S&P 500 happened to close below its 50DMA.
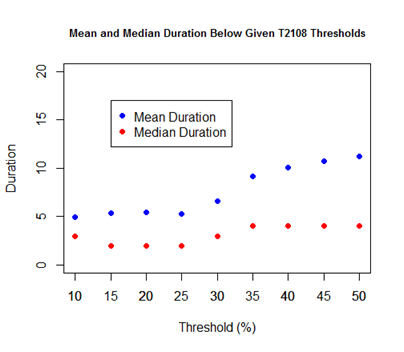
This chart shows that T2108 has traded below the 40% threshold for a longer time than average. This observation adds to my assumption that this is a stock market that wants to go up.
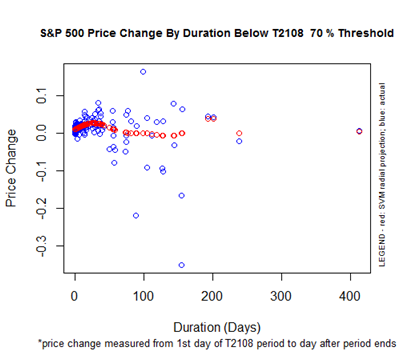
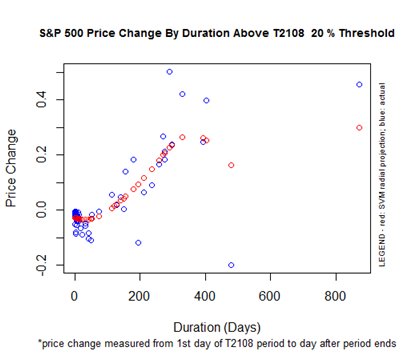
T2108 last traded above 70% on May 21st. The next day was a pivotal day that looked like a major reversal for the S&P 500 (see chart above). Two months later, T2108 stopped just short of returning to overbought conditions. As the chart above shows, the S&P 500 managed to print one last breakout before decidedly turning south again. With 74 trading days between here and the last close in overbought territory, the T2108 underperiod is now firmly in a region with a VERY wide spread of potential outcomes. Given the S&P 500 is only 14 points below the close on May 21st, the current bias is for the S&P 500 to trade significantly higher once it reaches overbought territory again. This bias is very consistent with my assessment that this is a market that wants to go up.
The chart above currently shows a significant downward bias if/when T2108 returns to oversold conditions anytime soon, as much as 10% downside. I think this describes the immediate downside risk. In another 50 trading days, the projection moves to flat and takes off significantly from there. In other words, if the S&P 500 does not sell-off soon, it is VERY likely to go on an extended rally. Yes, this is a market that wants to go up… (Note that the S&P 500 has to sell-off by 5% to return to even with the oversold reading from June 24).
Daily T2108 vs the S&P 500
")
Black line: T2108 (measured on the right); Green line: S&P 500 (for comparative purposes)
Red line: T2108 Overbought (70%); Blue line: T2108 Oversold (20%)
Weekly T2108

*All charts created using freestockcharts.com unless otherwise stated
Related links:
The T2108 Resource Page
Expanded daily chart of T2108 versus the S&P 500
Expanded weekly chart of T2108
Be careful out there!
Full disclosure: long SSO calls