
(T2108 measures the percentage of stocks trading above their respective 40-day moving averages [DMAs]. It helps to identify extremes in market sentiment that are highly gap down to reverse. To learn more about it, see my T2108 Resource Page. You can follow real-time T2108 commentary on twitter using the #T2108 hashtag. T2108-related trades and other trades are posted on twitter using the #120trade hashtag)
T2108 Status: 31.1%
VIX Status: 15.9 (surprisingly flat)
General (Short-term) Trading Call: Hold. Get ready for buying into oversold conditions.
Active T2108 periods: Day #48 over 20% (overperiod), Day #12 under 40%, Day #72 under 70%
Reference Charts (click for view of last 6 months from Stockcharts.com):
S&P 500 or SPY
SDS (ProShares UltraShort S&P500)
U.S. Dollar Index (volatility index)
VIX (volatility index)
VXX (iPath S&P 500 VIX Short-Term Futures ETN)
EWG (iShares MSCI Germany Index Fund)
CAT (Caterpillar)
Commentary
The S&P 500 (SPY) is seemingly already absorbing the geo-political risks from Syria as the U.S. moves ever closer to launching a strike against the country. The index had a major convulsion on Tuesday, ruining a strong first-trading-day-of-the-month opening. Today, the index regained its legs and closed higher than yesterday’s intraday high.
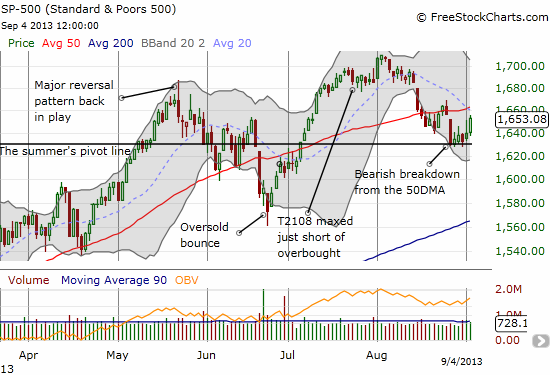
The strong open to post-summer trading puts the pivot line that marks an essentially flat summer into high relief. If the market sells off again soon, I am guessing this line will play a critical role in dividing between bearish and bullish scenarios. The S&P 500 and T2108 are now in synch again and looking to go even higher.
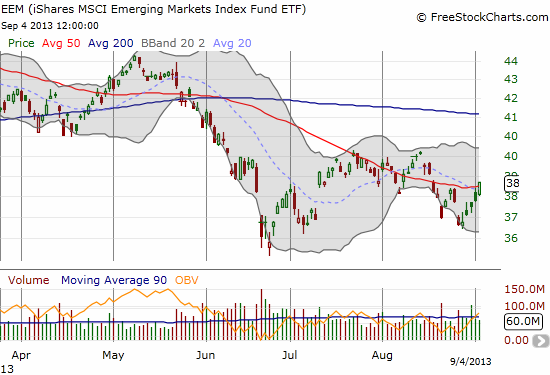
In the meantime, T2108 has surged from the brink of oversold territory and defied the bearish divergence I pointed out last Friday. Strategy-wise, I am still not opening up new bullish positions. I am very disappointed that oversold conditions may not be in the immediate future. I still have a shot on the bullish side with my standing call options, especially the fistful of QQQ calls. I did add to my hedge using puts on the iShares MSCI Emerging Markets ETF (EEM). I now own a fistful of those too!
Daily T2108 vs the S&P 500
")
Black line: T2108 (measured on the right); Green line: S&P 500 (for comparative purposes)
Red line: T2108 Overbought (70%); Blue line: T2108 Oversold (20%)
Weekly T2108

*All charts created using freestockcharts.com unless otherwise stated
Related links:
The T2108 Resource Page
Expanded daily chart of T2108 versus the S&P 500
Expanded weekly chart of T2108
Be careful out there!
Full disclosure: long SSO calls, long QQQ calls, long EEM puts