
(T2108 measures the percentage of stocks trading above their respective 40-day moving averages [DMAs]. It helps to identify extremes in market sentiment that are highly gap down to reverse. To learn more about it, see my T2108 Resource Page. You can follow real-time T2108 commentary on twitter using the #T2108 hashtag. T2108-related trades and other trades are posted on twitter using the #120trade hashtag)
T2108 Status: 23.4%
VIX Status: 17.0 (surprisingly flat)
General (Short-term) Trading Call: Hold. Get ready for buying into oversold conditions.
Active T2108 periods: Day #46 over 20% (overperiod), Day #3 under 30% (underperiod), Day #10 under 40%, Day #70 under 70%
Reference Charts (click for view of last 6 months from Stockcharts.com):
Reference Charts (click for view of last 6 months from Stockcharts.com):
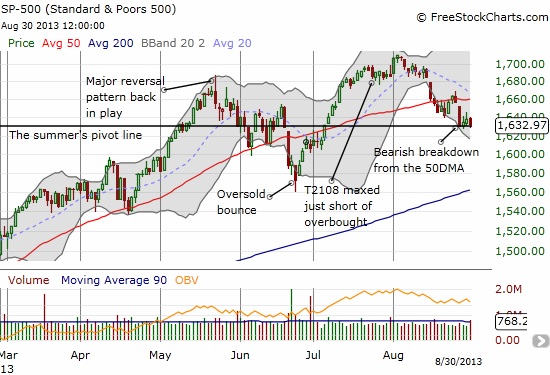
S&P 500 or SPY
SDS (ProShares UltraShort S&P500)
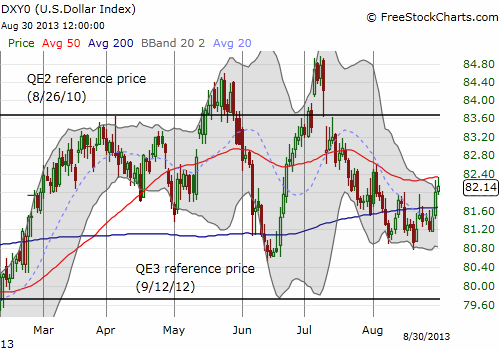
U.S. Dollar Index (volatility index)
VIX (volatility index)
VXX (iPath S&P 500 VIX Short-Term Futures ETN)
EWG (iShares MSCI Germany Index Fund)
CAT (Caterpillar)
Commentary
T2108 took a serious tumble toward oversold conditions on Friday (August 30, 2013) with a steep drop from 28.0% to 23.4%. Traders may never have guessed as much after seeing the S&P 500 (SPY) pull off its low for the week for a nearly flat close and after watching the volatility index, the VIX, pull back in relief for a nearly flat close. This is a bearish divergence that sets up a critical post summer trading session that will include geo-political drama along with the regular menu of economic signals and political stalemates.
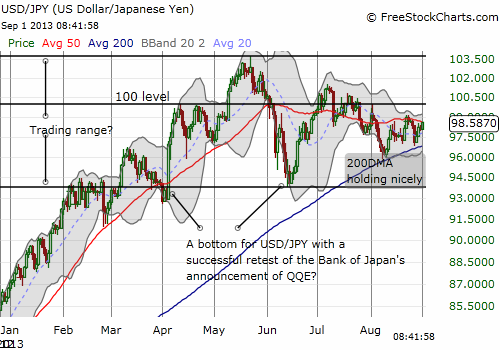
The currency markets are not providing many clues to the market’s true mood. Although it seems that the Japanese yen (FXY) is again taking over from the U.S. dollar as the choice currency of “safety.” So, look to the yen for any signs of nervousness. The yen ended the week selling off while the U.S. dollar gained steam from recent lows. Thus, by one measure, the market’s nervousness has abated somewhat even with the bearish divergence described above looming darkly over the market. I expect the currency markets overall to roil and boil much more than stock markets, so getting a definitive read will prove difficult from day-to-day. Note in the chart of USD/JPY that the 200DMA has held nicely and soon “decision time” will come when it converges with the relative flat 50DMA. I like trading in the direction of the breakout/breakdown (note I only go long the yen against currencies OTHER than the U.S. dollar given my longer-term bullishness on USD/JPY).
The trading strategy remains as before. Given the geo-political situation, I am going to be slow in pulling the trigger on long trades even when/if T2108 hits oversold. I was hoping for oversold conditions to occur along with the S&P 500 retesting support at the 200DMA. Unless the market craters quickly, such a powerful combo is not in the cards anytime too soon.
The rules for trading quasi-oversold conditions stay in place. For example, if T2108 plunges again on Tuesday, I will be nibbling on a VERY speculative trade, assuming the T2108 Trading Model (TTM) provides the green light. As always, look for my real-time signal on twitter.
For more details on my outlook and intermediate view, see “A Flat Summer For The First Time In 21 Years Balances Bears Versus Bulls.”
More than usual, be careful out there!
Daily T2108 vs the S&P 500
")
Black line: T2108 (measured on the right); Green line: S&P 500 (for comparative purposes)
Red line: T2108 Overbought (70%); Blue line: T2108 Oversold (20%)
Weekly T2108

*All charts created using freestockcharts.com unless otherwise stated
Related links:
The T2108 Resource Page
Expanded daily chart of T2108 versus the S&P 500
Expanded weekly chart of T2108
Be careful out there!
Full disclosure: long SSO calls, net long U.S. dollar, net long Japanese yen (short-term only)