
(T2108 measures the percentage of stocks trading above their respective 40-day moving averages [DMAs]. It helps to identify extremes in market sentiment that are highly gap down to reverse. To learn more about it, see my T2108 Resource Page. You can follow real-time T2108 commentary on twitter using the #T2108 hashtag. T2108-related trades and other trades are posted on twitter using the #120trade hashtag)
T2108 Status: 26.8%
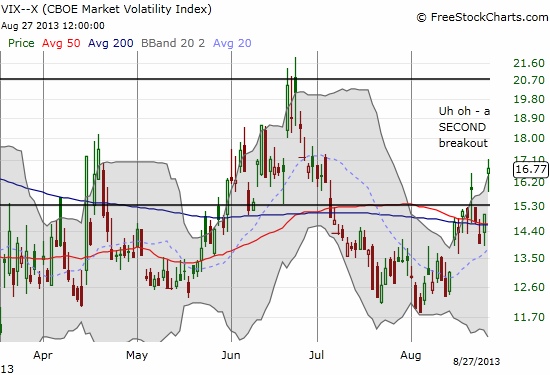
VIX Status: 16.8% (uh oh – another breakout)
General (Short-term) Trading Call: “Reset” – should be stopped out of 50DMA breakout trades. Ready powder for buys at oversold conditions.
Active T2108 periods: Day #44 over 20% (overperiod), Day #1 under 30% (underperiod), Day #8 under 40%, Day #68 under 70%
Reference Charts (click for view of last 6 months from Stockcharts.com):
S&P 500 or SPY
SDS (ProShares UltraShort S&P500)
U.S. Dollar Index (volatility index)
VIX (volatility index)
VXX (iPath S&P 500 VIX Short-Term Futures ETN)
EWG (iShares MSCI Germany Index Fund)
CAT (Caterpillar)
Commentary
I was clearly far too optimistic in my last T2108 Update to call the 50DMA a pivot point. Today, the S&P 500 (SPY) followed through on the previous day’s ugly fade to form a bearish breakdown from the 50DMA.
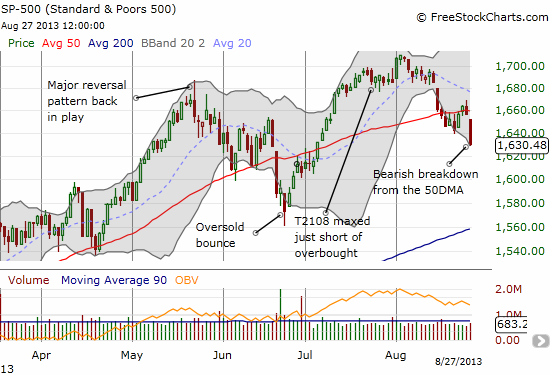
The S&P 500 is now at a 6-week or so low and now has the June lows as the next strong area of support, especially since it happens to coincide roughly with the 200DMA. At the current pace, T2108 will easily hit oversold this week, perhaps as early as tomorrow (Wed, August 28th). However, the strong headline risk from the possibility of a U.S. strike in Syria renders bullish trades particularly unattractive. This risk overrides any technical assessment.
For example, T2108 is now quasi-oversold with T2108 plunging 27% today and 31% over the last two days. The T2108 Trading Model (TTM) produces a convincing 78% chance of a positive close on the S&P 500 tomorrow. However, this prediction is practically useless since the model has no component that approximates geo-political turmoil or even some kind of adjustment factor for exogenous risks. Even when (if?) T2108 gets to oversold conditions, I will exercise patience. I know it sounds crude, but it is only when the bombs start dropping that the market finally expunges all its selling anxiety. Similarly, the market should soar the minute there is an indication that the U.S. will pursue an alternative to war with Syria. Since I am not likely to be watching the market at whatever moment relief comes, I will have to cap my patience at some point (AFTER T2108 hits oversold). I will make a bullish trade no matter what is happening if the S&P 500 retests its 200DMA and/or June lows during oversold conditions.
The VIX is adding to the red flag of further downside risks. It broke out above the 15.3 pivot point for the second in five trading days. This is a sign of gathering upside momentum (and downside momentum for the S&P 500).
My purchase of puts on the iShares MSCI Emerging Markets Index (EEM) proved timely. They nearly doubled in price as EEM gapped down to last week’s gap down low. I sold the puts as part of sticking to the rule of selling options upon a quick double. It was extremely tempting to hold on, but rules are rules. Moreover, the profits from the EEM puts paid for my purchase of QQQ calls last week. (I have not yet “paid for” my SSO calls!). I still think going short EEM should serve as an excellent hedge to long positions. However, I do NOT recommend aggressively biasing short because at any moment the market could launch higher on a relief rally.
On the worrisome front, Google (GOOG) is printing a very bearish pattern. It now looks like a stock to fade on rallies rather than a stock to buy on dips. A 200DMA retest seems almost certain as post-earnings selling seems to be gathering momentum on GOOG.
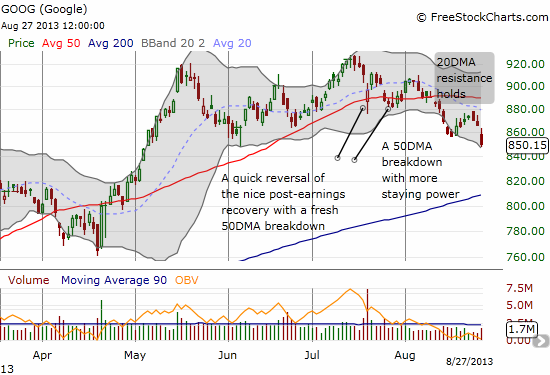
Note well how the 20DMA is definitely trending downward now. It served as perfect resistance last Friday on a day QQQ gapped up, and the S&P 500 closed above 50DMA resistance. I failed to jump on that warning of weakness because of my bullish bias on GOOG. That bias has completely reversed now.
Daily T2108 vs the S&P 500
")
Black line: T2108 (measured on the right); Green line: S&P 500 (for comparative purposes)
Red line: T2108 Overbought (70%); Blue line: T2108 Oversold (20%)
Weekly T2108

*All charts created using freestockcharts.com unless otherwise stated
Related links:
The T2108 Resource Page
Expanded daily chart of T2108 versus the S&P 500
Expanded weekly chart of T2108
Be careful out there!
Full disclosure: long SSO calls, long QQQ calls