(T2108 measures the percentage of stocks trading above their respective 40-day moving averages [DMAs]. It helps to identify extremes in market sentiment that are highly likely to reverse. To learn more about it, see my T2108 Resource Page. You can follow real-time T2108 commentary on twitter using the #T2108 hashtag. T2108-related trades and other trades are posted on twitter using the #120trade hashtag)
T2108 Status: 54.0% (ending a 13-day overbought period)
VIX Status: 14.8
General (Short-term) Trading Call: Hold shorts. New shorts should stop out on close above Tuesday, May 28th high.
Reference Charts (click for view of last 6 months from Stockcharts.com):
S&P 500 or SPY
SDS (ProShares UltraShort S&P500)
U.S. Dollar Index (volatility index)
VIX (volatility index)
VXX (iPath S&P 500 VIX Short-Term Futures ETN)
EWG (iShares MSCI Germany Index Fund)
CAT (Caterpillar)
Commentary
The day after the S&P 500 printed a major reversal pattern, the Japanese Nikkei Index tumbled 7.3%. I only realized the damage getting done after I posted my last T2108 Update announcing “Overbought Period Ends With Blow-Off Tops And Sell Signals.” While this plunge looks like a pindrop compared to the monster rally the Nikkei has had since November of last year, I think this ugly price action has all the tell-tale signs of a major top. Bull markets experience sharp corrections, but a 7% drop in one day is damaging, chaotic, and reeks of the kind of fear that is just getting started.
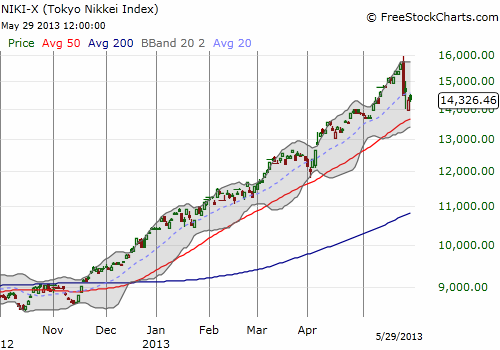
I start with this picture of the Nikkei because I think it is now acting like a negative feedback loop for the S&P 500. For momentum and trend chasers, the Japanese index is a sobering reminder of the price a trader may pay for chasing the S&P 500 (SPY) higher. Weakness in the S&P 500 will seem to confirm the end of the bull run for the Nikkei. Hand-in-hand these indices could take sentiment downward, providing important context for T2108.
As promised in the last T2108 Update, I finally started accumulating puts on ProShares Ultra S&P 500 (SSO). I tweeted these trades on twitter using the #120trade hashtag. So far, so good on the timing. My collective tranche was firmly in the green at the lows of the day, but the S&P 500 jumped off support at the 20DMA. This is the third day out of the last four trading days the S&P 500 has managed such a picture-perfect retest of this uptrend support. I do not expect it to last much longer.
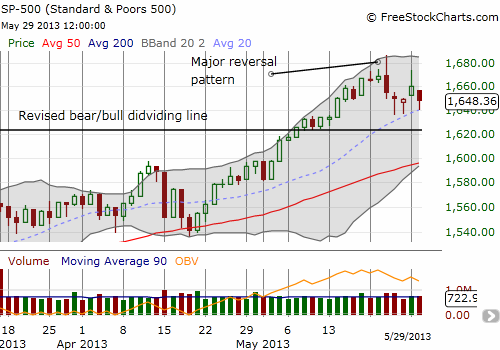
While I am freshly bearish, I am far from aggressively bearish. Once the S&P 500 crosses the bear/bull dividing line estimated above, there is not much room until an important retest of the 50DMA. The index has survived two retests this year of the 50DMA, so I will need to see a freshly bearish catalyst before concluding THIS TIME is different. Otherwise, I will be closing out my SSO puts at that point. Note also that the VIX has only slowly crept upward and is now right back to resistance-turned-pivot around 15.2. The VIX was turned back from that level to close slightly below it. A stronger move above this resistance will grease the skids for the S&P 500.
T2108 plunged today 14.5% just one day after it was rejected from the overbought 70% level. Now that intraday pricing is available, we can get more valuable insights on the likely direction for T2108. The intra-day chart of T2108 below makes it clear that T2108 experienced a resounding rejection, convincingly confirmed by today’s plunge.
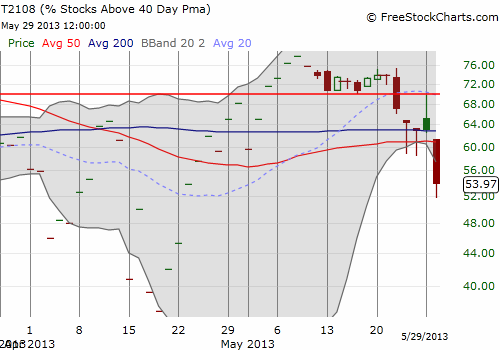
Based on all the evidence at hand, I am expecting the S&P 500 to finally break through its 20DMA support as early as tomorrow (May 30th). This will set up a 2-day “quasi-oversold” condition that will allow me to use projections from the T2108 Trading Model (TTM) to determine whether we should expect an immediate bounce. Given the depth of today’s plunge, I fully expect subsequent quasi-oversold conditions to point to a rebound. Next, I expect that rebound to trap bulls eagerly anticipating an end to the correction. This action will finally set up the next (and final?) leg of this corrective phase on the way to the 50DMA.
As always, I will take this one day at a time. Stay tuned.
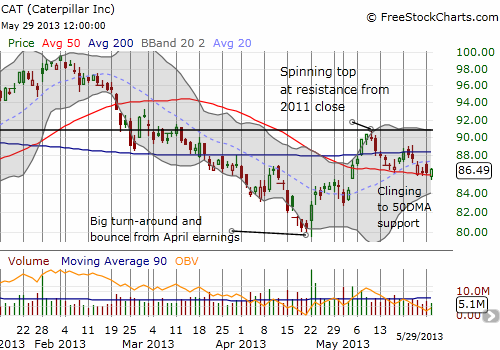
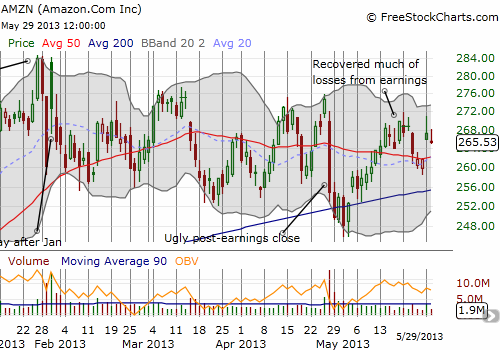
I conclude with a view on Caterpillar (CAT) and Amazon.com (AMZN). My trigger for puts on CAT is working well. AMZN on the other hand is behaving as stubbornly as ever. The post-earnings trigger only lasted for a day, and I did not take the small profits that small swoon produced. I think there is still time to catch the next swoon…
Daily T2108 vs the S&P 500

Black line: T2108 (measured on the right); Green line: S&P 500 (for comparative purposes)
Red line: T2108 Overbought (70%); Blue line: T2108 Oversold (20%)
Weekly T2108

*All charts created using freestockcharts.com unless otherwise stated
Related links:
The T2108 Resource Page
Expanded daily chart of T2108 versus the S&P 500
Expanded weekly chart of T2108
Be careful out there!
Full disclosure: long SSO puts, long CAT shares and puts, long AMZN put spread
