
(T2108 measures the percentage of stocks trading above their respective 40-day moving averages [DMAs]. It helps to identify extremes in market sentiment that are highly likely to reverse. To learn more about it, see my T2108 Resource Page. You can follow real-time T2108 commentary on twitter using the #T2108 hashtag. T2108-related trades and other trades are posted on twitter using the #120trade hashtag)
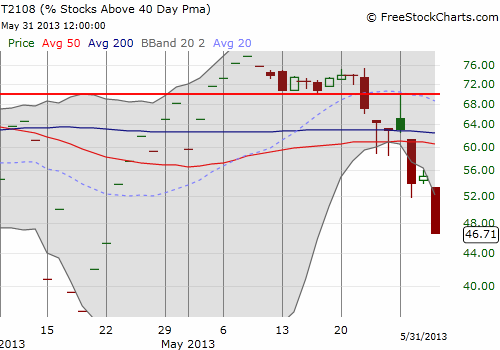
T2108 Status: 46.7% (plunge of 15.1%)
VIX Status: 16.3 (closed above critical resistance)
General (Short-term) Trading Call: Hold shorts.
Active T2108 periods: Day #30 of over 40% (overperiod), Day #1 under 50% (underperiod), Day #7 under 70% (underperiod)
Reference Charts (click for view of last 6 months from Stockcharts.com):
S&P 500 or SPY
SDS (ProShares UltraShort S&P500)
U.S. Dollar Index (volatility index)
VIX (volatility index)
VXX (iPath S&P 500 VIX Short-Term Futures ETN)
EWG (iShares MSCI Germany Index Fund)
CAT (Caterpillar)
Commentary
In the May 29th T2108 Update, I reemphasized my observations of “tremors” indicating a larger corrective phase is unfolding. That corrective phase is confirmed and underway.
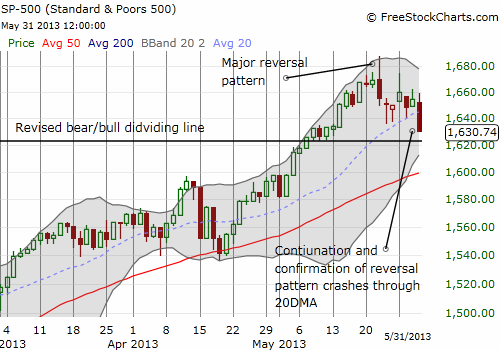
The S&P 500 (SPY) dropped 1.4% to close out trading for May. After knocking 3 days out of the previous 5, the index finally cracked through its 20DMA. It was a close call, but the index cracked this important uptrend support right on schedule. I was hoping for this breakdown to occur on Thursday. Such complete cooperation would have generated the quasi-oversold conditions I was anticipating. The intraday view of T2108 provides a clear view of the breakdown underway.
With the 50DMA for the S&P 500 hovering just above 1600, I am betting that a retest is right around the corner, as soon as the first week of June. There are two speed bumps along the way. First, there is the tendency of the first of the month to generate a stock market rally. If that happens, I suspect the tight cap for that rally will be the 20DMA, former support turned resistance. Second, there is a retest of the mini-consolidation period that forms the bear/bull dividing line. Selling should at least slow down around this point (although it does not have to of course).
The volatility index, the VIX, provides more interesting context. 2013 has only delivered two other corrective phases. Each one retested the 50DMA, and each one featured a VIX soaring above the 15.2 pivot I have noted multiple times. Each time, a close BELOW that pivot signaled the end (or imminent end) of the corrective phase. THIS corrective phase is different than the previous two in that at 7 days old, it has already lasted longer than the other two and the 50DMA is still a 1.8% decline away. This suggests to me that the VIX this time around could run much higher and for longer this time around. I will be keeping a closer eye on the VIX now for additional clues on the duration of this corrective phase.
For now, I am holding onto the puts on ProShares Ultra S&P 500 (SSO) I bought to play my T2108-inspired prediction of a corrective phase. The small irony is that on Friday these puts went from a small loss to a sizeable gain all in one day as the S&P 500 first rallied, settled back down to the 20DMA, and then rushed downward into the close. A large chunk of the day’s losses happened in just the final 15 minutes of the day and most of THAT loss happened in the final 5 minutes! Such a sudden rush for the exits could attract buyers come Monday morning (June 3rd) since they had little time to react to the “bargains” so close to the end of the trading day. This rush to fill Friday’s buying vacuum could form the spark for a first-of-the-month rally. Working against the odds for a rally is a tendency this year for the the S&P 500 to sell-off on Mondays (see “Daily S&P 500 Trading: Monday Under-Performance, Tuesday Out-Performance And Other Patterns“). Interestingly, this Friday was the FIRST Friday of this year to close with a loss greater than 0.5%. The stakes for Monday are indeed high!
So, overall, the overhaul of the T2108 Trading Model (TTM) continues to pay nice dividends. You may have noticed that I am now including a note on the durations of the current overperiod and underperiod in the status summary. I will also include here any related trade triggers. This is the 30th straight trading day that T2108 has traded above 40% (the overperiod), the first day trading under 50% (the underperiod), and the seventh day trading under 70%. I track all over and underperiods that make sense: the closest and the furthest thresholds. For the 40% overperiod, the performance projection now has a positive slope that has almost reached 0%. The S&P 500 is up 4.9% for this overperiod. The odds are VERY high that when this overperiod ends, the S&P 500 will record a performance at the high end of the expected range. At T2108’s current rate of decline, a retest of the 50DMA will take T2108 well below 40%. I would not be surprised if T2108 flashes oversold (20% or lower) at that point.
As I noted in a prior post, the 70% underperiod will not be meaningful for a long time. The 50% underperiod is not much better (graph not shown). The projection going out to around day #30 is flat (and just above 0%); after that, a steep declie in expected performance begins.
(Programming note: I am VERY behind on posting links to my recent Seeking Alpha articles. My apologies! Please be aware that in the coming days I will be posting important articles summarizing May’s trading action, the likely importance of the bearish action in Australia, and my thoughts on gold and currencies).
Daily T2108 vs the S&P 500
")
Black line: T2108 (measured on the right); Green line: S&P 500 (for comparative purposes)
Red line: T2108 Overbought (70%); Blue line: T2108 Oversold (20%)
Weekly T2108

*All charts created using freestockcharts.com unless otherwise stated
Related links:
The T2108 Resource Page
Expanded daily chart of T2108 versus the S&P 500
Expanded weekly chart of T2108
Be careful out there!
Full disclosure: long SSO puts