(T2108 measures the percentage of stocks trading above their respective 40-day moving averages [DMAs]. It helps to identify extremes in market sentiment that are highly likely to reverse. To learn more about it, see my T2108 Resource Page. You can follow real-time T2108 commentary on twitter using the #T2108 hashtag. T2108-related trades and other trades are posted on twitter using the #120trade hashtag)
T2108 Status: 48.0%
VIX Status: 13.9
General (Short-term) Trading Call: Hold
Reference Charts (click for view of last 6 months from Stockcharts.com):
S&P 500 or SPY
SDS (ProShares UltraShort S&P500)
U.S. Dollar Index (volatility index)
VIX (volatility index)
VXX (iPath S&P 500 VIX Short-Term Futures ETN)
EWG (iShares MSCI Germany Index Fund)
CAT (Caterpillar)
Commentary
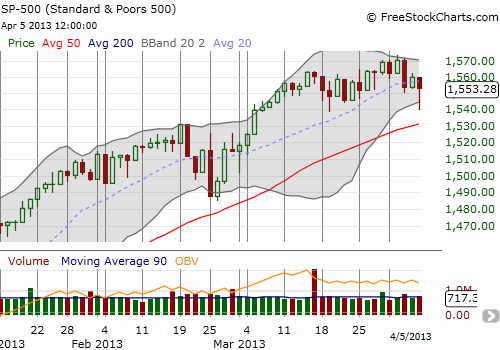
As luck would have it, the SSO put I bought on Thursday to play the T2108 Model tripled in value when I sold it in the wake of Friday’s opening sell-off. The S&P 500 trembled as U.S. unemployment numbers were much worse than expected. However, after the index tagged its lower-Bollinger Band, I realized the action set up a fresh buying opportunity. I am now long SSO calls. (You can follow my real-time commentary on twitter. The trades are tagged with the #120trade hashtag.). Those calls increased in value over 30% by the close as the S&P 500, almost predictably, bounced off the lower-BB. After it is all said and done, the S&P 500 has still gone nowhere for a month.

The opening excitement drove the VIX right to its 200DMA and just above the all-important resistance/support level of 15.3. Again, almost predictably, the VIX soon faded from these resistance levels and closed right where it closed the previous day. This action sets up a likely positive day on Monday where I will most likely sell my SSO calls.
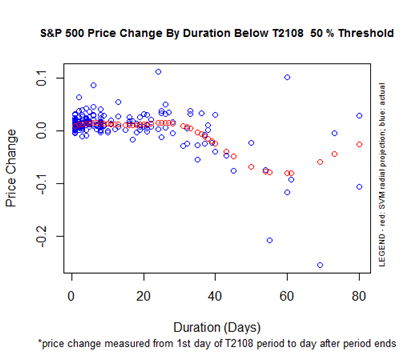
T2108 dropped just slightly to 48.0%. It first dropped below 50% two days ago. The S&P 500’s performance since then is exactly 0%. This is important because my T2108 model suggests the S&P 500 will have a positive bias until this “under period” lasts about 30 days. The chart below shows historical performance of the S&P 500 from the first day T2108 closes below 50% to the first day it rises above 50%. The blue dots show actual performance. The red dots show the predicted performance (using Support Vector Machines {SVM} with a radial projection for you data mining/machine learning types). The x-axis measures how long (the duration) T2108 remains below the 50% threshold.

What this chart does not show is the range of expected performance WHILE T2108 makes it way above the 50% threshold again. Making the drawdown risks explicit is one of the many to-dos ahead of me before I fully publish my results of the T2108 overhaul. Note well that being able to examine S&P 500 behavior above and below ANY threshold is one of the several improvements I have made. This rethink is part of what makes the concepts of overbought and oversold a lot more squishy and a little less relevant to the overall analytic framework. Stay tuned for more.
Daily T2108 vs the S&P 500

Black line: T2108 (measured on the right); Green line: S&P 500 (for comparative purposes)
Red line: T2108 Overbought (70%); Blue line: T2108 Oversold (20%)
Weekly T2108

*All charts created using freestockcharts.com unless otherwise stated
Related links:
The T2108 Resource Page
Expanded daily chart of T2108 versus the S&P 500
Expanded weekly chart of T2108
Be careful out there!
Full disclosure: long VXX shares and puts; long SSO calls

Hello Dr.
Could you please explain how you named T2108? It is obvious you are into numbers big time..i.e. One-twenty two 122.. I think you’re on to something, others call their market timing “crystal ball” “smart money indicator” yours is “T2108”. What has your history of accuracy been with your T2108 concept, how long have you used it?
Silver182@aol.com
Thanks,
In&Out…Lee
T2108 is straight from Worden’s stock charting programs (for example, see FreeStockCharts.com). I have been trying to think of a better name for it, but no luck yet! Fortunately, I have been allowed to keep using it. 🙂
I have not kept specific track of T2108 accuracy, but it has kept me out of trouble enough for me to keep using it. Starting in 2011, I tried to keep better track by dedicating a portfolio to just T2108-related trades. 2011 happened to be a banner year for the indicator. 2012 was not good as I got distracted by some disastrous trades like VXX. I hope to soon get back to a pure T2108 portfolio so I can answer questions like yours.
Stay tuned!