(T2108 measures the percentage of stocks trading above their respective 40-day moving averages [DMAs]. It helps to identify extremes in market sentiment that are highly likely to reverse. To learn more about it, see my T2108 Resource Page. You can follow real-time T2108 commentary on twitter using the #T2108 hashtag. T2108-related trades and other trades are posted on twitter using the #120trade hashtag)
T2108 Status: 48.5%
VIX Status: 13.9
General (Short-term) Trading Call: Hold
Reference Charts (click for view of last 6 months from Stockcharts.com):
S&P 500 or SPY
SDS (ProShares UltraShort S&P500)
U.S. Dollar Index (volatility index)
VIX (volatility index)
VXX (iPath S&P 500 VIX Short-Term Futures ETN)
EWG (iShares MSCI Germany Index Fund)
CAT (Caterpillar)
Commentary
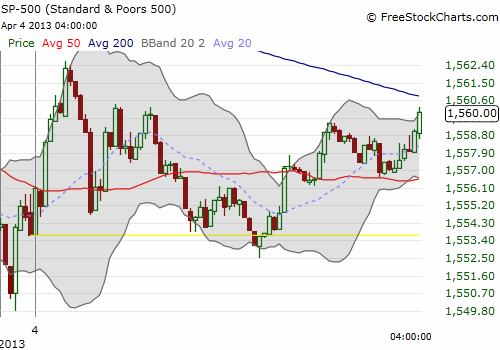
I was hoping that my first application of the new T2108 Model would accurately predict the S&P 500 today, so that I could declare myself a pure genius. Unfortunately, such glory is clearly not my destiny. Instead, my prediction for a down day on the S&P 500 came up snake eyes as the index closed up marginally 0.40%. It was a close call though as the intra-day chart below demonstrates. The yellow line represents yesterday’s close – the index was actually in negative territory for all of 10 minutes or so. It was a day of major chop.

In my post announcing a new beginning for T2108, I introduced the term “prediction utility” as a replacement for prediction accuracy. Today was a case study. The prediction of the model was wrong for the day, BUT it was useful in that going long (bullish) for today would have likely led to losses. That is, if I had gone into the day with bulls on the brain, I would have bought quickly expecting to ride the day to much higher highs. Instead, I likely would have stopped out once the market rolled over negative for a brief moment. Of course, with a trading computer, I could have bought the open and exited a bullish trade within 30 minutes.
Just to put some money where my mouth was, I bought a single SSO put soon after the open, excited I got a better price to play a down day. As the chart shows, if I had waited until just 10am Eastern (the earliest time I am supposed to make ANY trade), I would have been able to play a nice fade to lows of the day. Lessons learned!
T2108 increased for the day, so I have no prediction for tomorrow. The S&P 500 climbed back above its 20DMA so technically it is in full bull territory again. The stock market action was amazingly tame given what was going on in currencies overnight and in the morning. I will write a separate post on this soon, but the Japanese yen (FXY) soared like crazy on the heels of an extremely aggressive Bank of Japan decision on monetary policy. This in turn caused huge swings in other currency pairs, especially when the central banks from the eurozone and the UK weighed in. I am surprised our stock market did not soar given the clear opportunity for more carry trades on the back of a weakening yen. Next up is the U.S. unemployment report where currencies should again gyrate wildly.
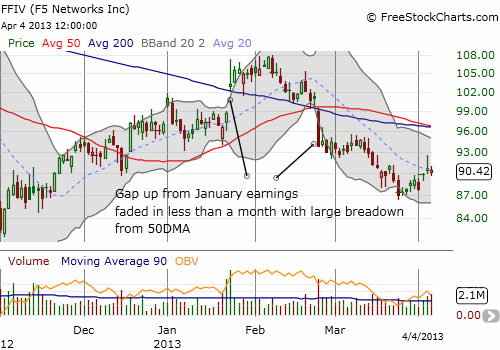
Finally, in news that is bad for tech stocks, F5 Networks (FFIV) warned tonight on Q2 earnings and revenue. The stock plunged 16% or so in after hours and took down related networking stocks. I do not think this is a buying opportunity. The stock had long ago faded the nice gains from January earnings. The decline ever since against the market uptrend was everyone’s red flag. Investors/traders clearly sniffed out something and from the looks of it, this is not a one quarter blip.

Daily T2108 vs the S&P 500

Black line: T2108 (measured on the right); Green line: S&P 500 (for comparative purposes)
Red line: T2108 Overbought (70%); Blue line: T2108 Oversold (20%)
Weekly T2108

*All charts created using freestockcharts.com unless otherwise stated
Related links:
The T2108 Resource Page
Expanded daily chart of T2108 versus the S&P 500
Expanded weekly chart of T2108
Be careful out there!
Full disclosure: long VXX shares and puts; long SSO put
