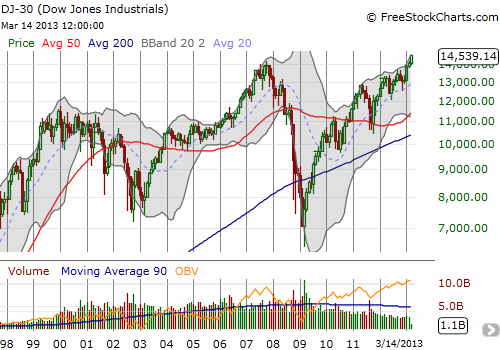
I do not pay much attention to the Dow Jones Industrial Average (DIA) and greatly prefer the S&P 500 (SPY) as being more representative of the stock market. However, anyone with a pulse has likely heard or read the breathless headlines about the Dow’s all-time highs.

The Dow is now up ten days in a row, a feat not seen since 1996. Yet, as Art Cashin remarked on CNBC, this is a rally without joy or enthusiasm. Bears may call this catatonic state complacency; contrarians may delight in this mood as it could demonstrate the market is far from the euphoria that usually marks tops. What I have noted is that not even stocks are participating in this euphoria in a broad sense.
First of all, of the 30 stocks in the Dow, only 10 are hitting all-time highs along with the index. Those stocks are 3M Company (MMM), American Express (AXP), Chevron Corporation (CVX), Home Depot (HD) {marginally}, International Business Machines (IBM), Johnson & Johnson (JNJ), Procter and Gamble (PG), Travelers Companies (TRV), United Technologies (UTX), and Walt Disney Company (DIS). Caterpillar (CAT) gets special mention because it made new all-time highs in 2011 but has since sold off over 25%. The divide between these star performers and the rest of the pack is relatively wide. Stocks like Aloca (AA), AT&T (T), Bank of America (BAC), Cisco (CSCO), General Electric (GE), Hewlett Packard (HPQ), Intel (INTC), Merk (MRK), Microsoft (MSFT), and Verizon (VZ) are nowhere near their all-time highs, constituting another 1/3 of the index.
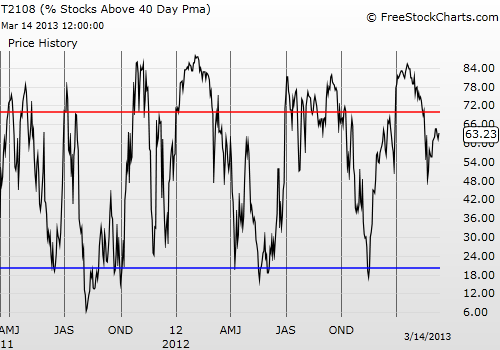
This dichotomy can be seen in the general market. An indicator I like to follow is the percentage of stocks trading above their 40-day moving averages (DMA). In FreeStockCharts.com, it is called T2108. I follow this index closely in my T2108 Updates. Currently, T2108 is at 63%. This means that almost 40% of stocks are trading below their 40DMAs. These are all stocks nowhere near their all-time highs. Typically, during a strong rally like the current one, T2108 moves into “overbought” territory which is 70% or higher. With the S&P 500 a mere few points away from its all-time high, I would have expected T2108 to be closing in on 80% or more. Instead, it seems a good number of stocks are getting left behind.

Note that when the stock market exploded higher to start the new year, T2108 went as high as 85%. The 20 percentage point differential between then and now, represents a large number of stocks whose performance has sharply diverged from that of the S&P 500 (or stock market in general). This setup provides a very good reason to hold the enthusiasm or joy: the lofty heights are not getting broadly shared.
Currently, T2108 has bounced between 60 to 65% since March 5th. The S&P 500 is up a mere 1.3% since then. Without more participation, the S&P 500’s rally should continue to lack luster. I will be looking to see whether T2108 can break out and finally join the S&P 500 in its upward climb. Until then, I will continue to assume that the rally is at high risk of an imminent correction.
Be careful out there!
Full disclosure: long CAT
