(T2108 measures the percentage of stocks trading above their respective 40-day moving averages [DMAs]. It helps to identify extremes in market sentiment that are highly likely to reverse. To learn more about it, see my T2108 Resource Page. You can follow real-time T2108 commentary on twitter using the #T2108 hashtag. T2108-related trades and other trades are posted on twitter using the #120trade hashtag)
T2108 Status: 17.3% (oversold day #2)
VIX Status: 18.0
General (Short-term) Trading Call: Start closing out shorts; if aggressive, start buying; if conservative, try to wait for higher VIX, a large spike into mid-20s would be ideal (but note that if VIX does not spike, conservative traders will likely miss the best entry points)
Reference Charts (click for view of last 6 months from Stockcharts.com):
S&P 500 or SPY
SDS (ProShares UltraShort S&P500)
U.S. Dollar Index (volatility index)
VIX (volatility index)
VXX (iPath S&P 500 VIX Short-Term Futures ETN)
EWG (iShares MSCI Germany Index Fund)
CAT (Caterpillar)
Commentary
The market continues to absorb oversold conditions with a healthy dose of calm. The S&P 500 (SPY) ended essentially flat and was even up for the day at one point. However, T2108 slipped another two percentage points to 17.3%. The last T2108 Update still summarizes well my approach to these particular oversold conditions, so I will not repeat them here. Instead, I will turn attention back to the NASDAQ (QQQ) and financials.
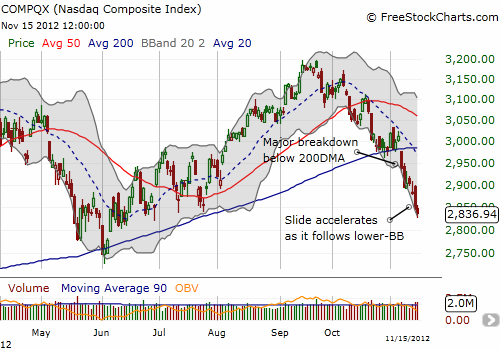
While the S&P 500 is still clinging to about half its gains from the June low, the NASDAQ has lost exactly 80% of its gains since the June low.

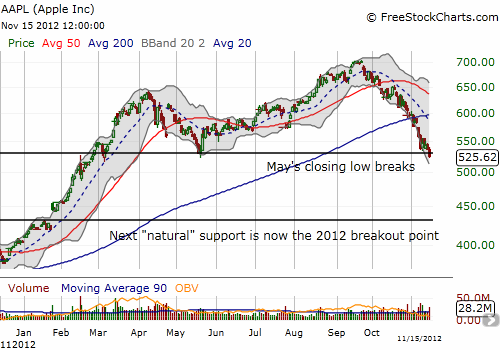
Much of this decline has occurred thanks to a continued vicious slide for Apple (AAPL). While I am bullish on Apple the company, AAPL the stock is quite bearish. Ever since printing its last all-time high above $700, AAPL has sold off with little respect for “natural” support lines. AAPL did not pause at its 20DMA, had a tepid 2-day bounce off 50DMA support, had an even more tepid 1-day bounce off the 200DMA, and today sliced right through the May closing low. Now, the next natural support is over 100 points away where the 2012 big breakout occurred that led to Apple’s once royal gains.

Apple’s slide is leading the way for tech stocks. While the stock is surely highly oversold, especially based on the high-volume selling that is dragging the stock along the lower-BB, it is now hard to put a stake in the ground for where the stock will find ANY real buying support.
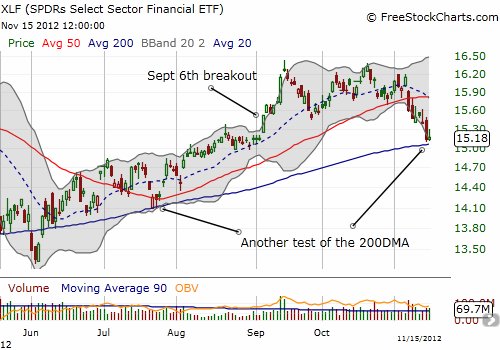
In the meantime, financials are finally breaking down as well. The SPDRS Select Sector Financial ETF (XLF) broke through its uptrend defined by the 50DMA last Wednesday. XLF has spent the last two days making a tepid attempt to defend support at the 200DMA. XLF has now lost all its gains from the big breakout on September 6th. A breakdown below 200DMA will seal the deal for an even more bearish tone for the market.

In the meantime, the VIX barely budged and is still lower than where it was last week. Fear is not yet present in the market. I am still interpreting this to mean there is a lot more downside potential if/when fear finally grows. I already have SSO shares, so I will wait until VIX spikes higher to add any more. (Bill Luby from “VIX and More” just pointed me to an article he wrote in August pointing out how the roll of the VIX between near-term and far-term volatility options can produce surprising results on the VIX. Moreover, he suspects holiday trading may also be suppressing the VIX. Still, my gut tells me that the market should be showing more fear under the current circumstances).
Daily T2108 vs the S&P 500

Black line: T2108 (measured on the right); Green line: S&P 500 (for comparative purposes)
Weekly T2108

*All charts created using freestockcharts.com unless otherwise stated
Related links:
The T2108 Resource Page
Expanded daily chart of T2108 versus the S&P 500
Expanded weekly chart of T2108
Be careful out there!
Full disclosure: long SSO calls and shares, long VXX shares and puts, long AAPL
