(T2108 measures the percentage of stocks trading above their respective 40-day moving averages [DMAs]. It helps to identify extremes in market sentiment that are highly likely to reverse. To learn more about it, see my T2108 Resource Page. You can follow real-time T2108 commentary on twitter using the #T2108 hashtag. T2108-related trades and other trades are posted on twitter using the #120trade hashtag)
T2108 Status: 41.1%
VIX Status: 17.6
General (Short-term) Trading Call: Hold
Reference Charts (click for view of last 6 months from Stockcharts.com):
S&P 500 or SPY
SDS (ProShares UltraShort S&P500)
U.S. Dollar Index (volatility index)
VIX (volatility index)
VXX (iPath S&P 500 VIX Short-Term Futures ETN)
EWG (iShares MSCI Germany Index Fund)
CAT (Caterpillar)
Commentary
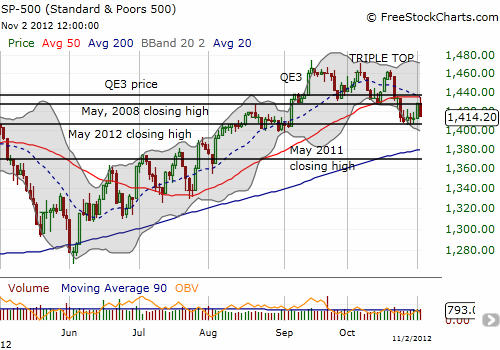
The market was closed for the first two days of this week due to the damage and chaos of Hurricane Sandy. The market opened to what I am calling churn and burn. On Wednesday, the market ended flat after first opening up, selling off to a small loss, and then bouncing back to end flat. This turned out to be a microcosm of the next two days which featured a huge rally on Thursday followed by a huge sell-off on Friday. Neither move made much sense, so it is just as well the S&P 500 ended the week with no progress. I think this week will be a microcosm for the year.
The larger technical context to trading this week was support from the May, 2012 closing high and overhead resistance from the S&P 500’s QE3 price and the 50DMA. The triple-top that printed across September and October still loom large overhead.

T2108 ended the week three percentage points higher than last week. I had thought this would be the week T2108 hits oversold territory for the first time in five months. Now, it seems unlikely to do so for the foreseeable future.
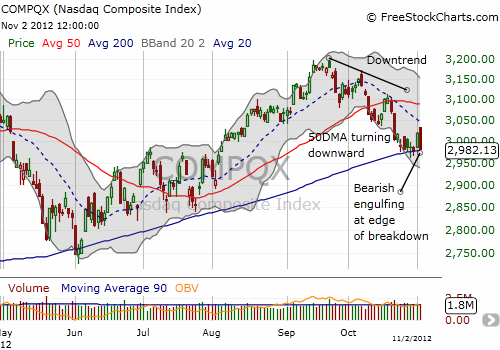
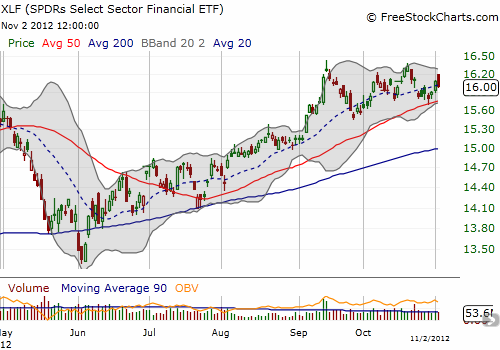
On either side of the S&P 500 are two important developments: sinking tech stocks and resilient financial stocks. The NASDAQ (QQQ) continues to teeter on critical 200DMA support. Friday printed a bearish engulfing pattern that seems certain to weigh the index through a major breakdown. On the other hand, the SPDRs Select Sector Financial ETF (XLF) remains comfortably above BOTH its uptrending 50 and 200DMAs.


I think it is impossible to say which side will win, but I am now monitoring both developments carefully. For now, my bias remains mildly bearish, somewhat moderated by what still seems like bullish divergence from the currency market. This bias will change if T2108 prints oversold OR the S&P 500 manages to overcome triple top resistance. Given my expectations for a “churn and burn” market through the rest of this year, I doubt either milestone will get hit. Each milestone could get tested and generate false hopes and/or doom. The biggest wildcard will be the market’s response to the approaching fiscal cliff deadline.
Daily T2108 vs the S&P 500

Black line: T2108 (measured on the right); Green line: S&P 500 (for comparative purposes)
Weekly T2108

*All charts created using freestockcharts.com unless otherwise stated
Related links:
The T2108 Resource Page
Expanded daily chart of T2108 versus the S&P 500
Expanded weekly chart of T2108
Be careful out there!
Full disclosure: long SSO calls, long VXX shares and puts
