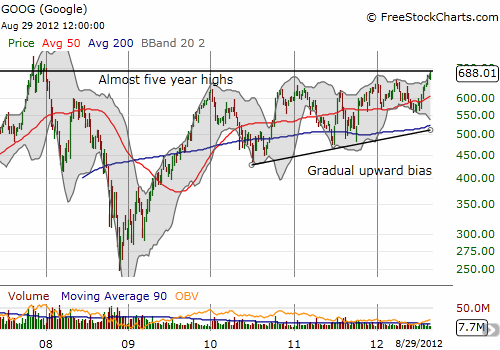
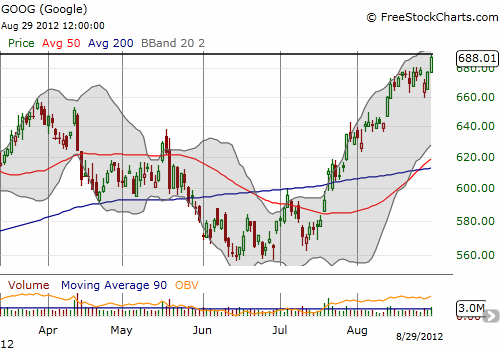
The stocks market’s slow action hides all sorts of dramatic action in individual stocks. For this chart review, I take a look at a range of performers. Google (GOOG) has broken out to fresh five-year highs. First Solar (FSLR) has more than doubled since its June lows. Baidu (BIDU) has sold off for over a week on high volume. Intel’s recent downtrend from May highs remains well intact and is retesting critical 2013 support. Joy Global (JOY) enjoyed a tremendous post-earnings comeback. Finally, Caterpillar (CAT), my favorite canary in the coal mine, bounced back in sympathy with JOY from its 50 DMA. Here are the charts that tell their stories:
Google started the week with a nice gap down in sympathy with Samsung’s sounding patent defeat versus Apple (AAPL) in U.S. courts. I was too slow to take advantage and dump a put spread I happened to have active. In just two more days, GOOG has not only filled Monday’s gap down but also broken out to new 5-year highs. I do not think this will last given the stock has gained 21% in just six weeks in what I can only describe as the mass migration of money that previously chased the hottest internet-related IPOs. However, if the stock market goes higher from current levels, GOOG will also go higher before going lower again.
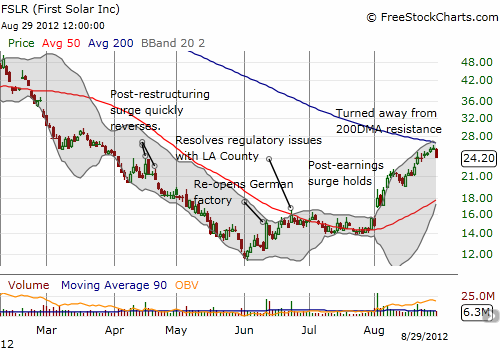
I last wrote about First Solar (FSLR) calling it a trading stock (see “First Solar Is Still Just A Trading Stock“). Since then, the stock has traveled another 10% higher. That march has come to another pause as the stock got rejected at 200DMA resistance and fell 5.8%. FSLR is another case where the bias is bearish (even more so than GOOG), but it will go higher before going much lower if the general stock market lifts from here. FSLR has clearly caught the fancy of traders as momentum stock. And with shorts overcrowded into this stock to the tune of 63.5% of float, it seems almost all interested sellers may already be in this one. I have very mixed feelings on FSLR since I am short-term bearish (long puts) and longer-term bullish (short puts).
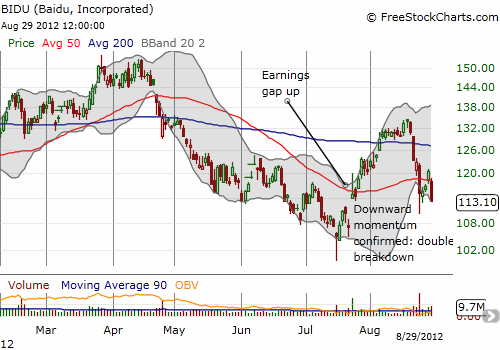
Baidu (BIDU) has been hit with analyst downgrades and, apparently, a growing search war with fellow Chinese internet company Qihoo 360 (QIHU). The 4-day plunge last week through both the 200 and 50DMAs looked like a “fatal” blow that would quickly take the stock back to $100. I set up a short position hedged by calls, and, sure enough, BIDU bounced right back. However, Wednesday’s blow is a confirmation of BIDU’s bearish descent and increases the likelihood of hitting $100 and lower. The stock gapped down on high volume below 50DMA support and kept selling until the close. A stock cannot get much more bearish than that. This candlestick pattern is also known as a “falling 3 method” – three days of (relief) buying sandwiched between 2 days of heavy selling – which confirms downward momentum.
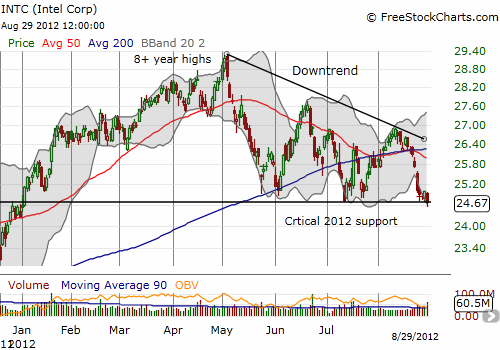
Intel is a surprise member of the “breakdown club.” With the stock market scratching at multi-year highs, I expected a cyclical stock like Intel (INTC) to keep pace. Instead, INTC is still trapped within a downtrend from its May high (which itself was an incredible 8+ year high). The stock is trading near its low for 2012 and is essentially flat year-to-date. On Wednesday, the stock traded below support before closing right on top of it. With selling volume high, I doubt INTC can avoid a more severe breakdown much longer. (Note how INTC’s last failure at the downward trend line pushed it below the converged 50 and 200DMAs. THAT was the spot to short the stock, and I missed it because I was trying for a “better’ price).
I was wrong to sell INTC early into the 2009 rally, abandoning my plans to hold the stock for a double in five years (it happened 18 months ahead of schedule!). I was also wrong to predict that INTC’s margins had peaked in October, 2009. However, I think the technicals are again clear. INTC is headed much lower soon. Only a break of the current downtrend will shift my assessment.
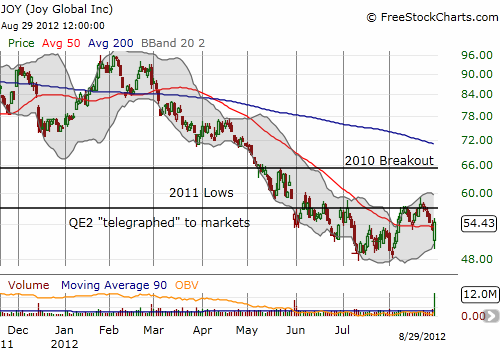
Joy Global (JOY) reported earnings before market open August 29th. The company slightly lowered FY12 revenue and earnings guidance and immediately lost almost 6% at the open. I barely had time to think on this one, but I remembered the post-earnings reaction to May earnings bottomed for a few days after gapping down. When a tweeter named @FirstAdopter tweeted the following: “$JOY is down -6.8% in the last 2 days. $CAT is only down -2.5%. Hmm,” I felt I had to act automatically. I bought shares and place a limit order for Sept $55 calls. The order never filled and when I saw the share position was already up almost 10%, I pulled the sell trigger (I missed out on a near triple in the calls!). The stock action is bullish with a bullish engulfing pattern taking JOY back above its 50DMA, but I do not like JOY for a longer trade until it can conquer resistance from recent highs in August that roughly market the May post-earnings high. In the chart below, I include two lines to mark important milestones. I hope to soon have more to say about JOY’s fundamentals and its views on the global economy, especially China.
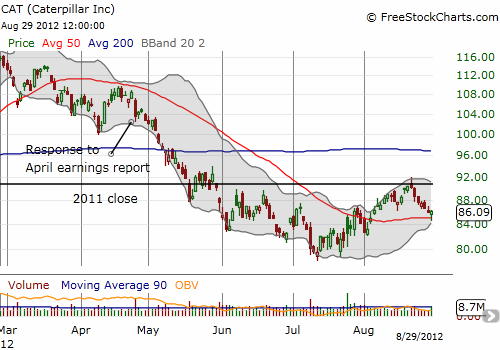
Finally, there is Caterpillar (CAT). I keep an eye on this stock almost every day as I look for confirmation/invalidation of market moves. I include CAT here only because of its role in helping me trade JOY successfully. Note how CAT neatly retested the 50DMA by dipping ever so slightly before it and then rallying to close with a hammer pattern. CAT can likely rally right back to recent resistance around $91 (where it closed 2011). However, this line has proven hard to break and after that will be an even tougher battle with the 200DMA.
Source for charts: FreeStockCharts.com
Full disclosure: long AAPL calls and puts, short GOOG (including put spreads), short BIDU and long BIDU calls, long CAT shares and calls
