(This is an excerpt from an article I originally published on Seeking Alpha on June 11, 2012. Click here to read the entire piece.)
In several past pieces on natural gas this year (for example, “Exports Of Liquefied Natural Gas Add To Evidence Of Bottoming Natural Gas Prices“), I have offered San Juan Basin Royalty Trust (SJT) as one alternative to the United States Natural Gas ETF (UNG) for playing a bottoming in natural gas prices. While noting the technical price risks in SJT, I did not have a 22% drop in five days (May 29th to June 4th) on my radar. That loss exceeded UNG’s loss of 7% over the same period. (SJT’s loss for 2012 of 45% is now below UNG’s year-to-date loss of 38%). I wondered whether any other factors beyond weakening macroeconomic conditions are impacting SJT’s performance. I read through the last financial report and 10Ks (annual reports) from 2011 and 2008 in search of clues. I did not find anything of particular alarm, but I do want to highlight some key information to consider going forward. {snip}
Click for a larger view..
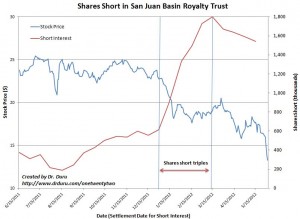
Source: Short interest from NASDAQ, stock price from FreeStockCharts.com
Although relative short interest remains small, it is clear that a few traders have sniffed out opportunity in SJT’s price decline. {snip}
Starting in 2009, distributions per unit have hit their lowest point since the early 2000s. In fact, these distributions are in general decline since hitting a peak in 2005:
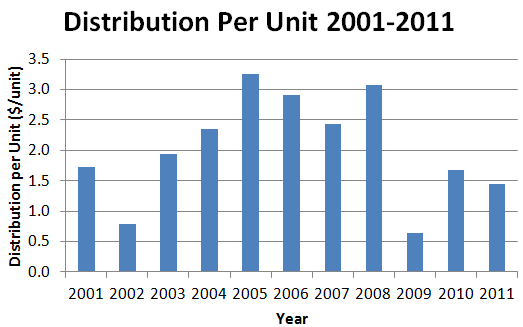
Source: San Juan Basin Royalty Trust website
While distributions have fluctuated widely, production over at least the last five years has declined very slowly. Production in 2011 was 11% below production in 2007 when the economy was at its peak.

Source: SJT Annual Report and 10K for 2011
{snip} Proved reserves have dropped 30% since 2007 (so faster than the drop in production) and now sit at 135,941 Mcf…

{snip}
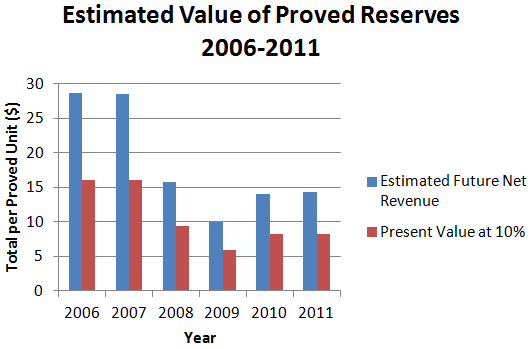
{snip} The chart below shows that the only consistent relationship from year-to-year has been in the last three years between the median price and SJT’s estimates.
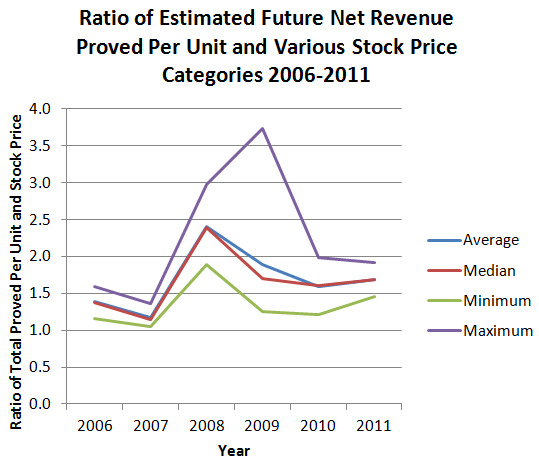
It almost appears that all these valuations are converging but confirmation would take another two years or so of data and/or more granular data. Regardless, it is at least reassuring that the ratio using the median and average annual stock prices are not trending higher or lower over recent history.
The final place I looked for trouble was in litigation. {snip}
So, overall, for now, I think it is sufficient to think of SJT in terms of the prospects for natural gas prices to bottom. {snip}
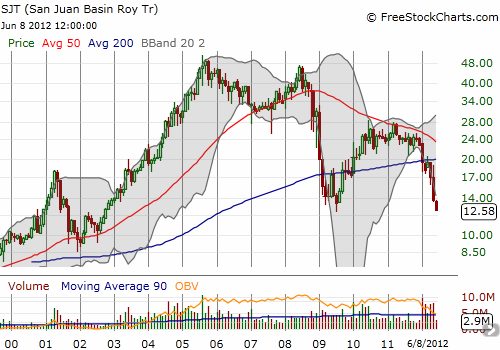
SJT is now a breath away from its historic 2009 lows which in turn represented prices unseen since 2002. This seems far too cheap to me, but I realize I am talking into the market’s headwind given the vicious downtrend. {snip}
Source: FreeStockCharts.com
Be careful out there!
(This is an excerpt from an article I originally published on Seeking Alpha on June 11, 2012. Click here to read the entire piece.)
Full disclosure: long SJT
