(T2108 measures the percentage of stocks trading above their respective 40-day moving averages [DMAs]. To learn more about it, see my T2108 Resource Page. You can follow real-time T2108 commentary on twitter using the #T2108 hashtag. T2108-related trades and other trades are posted on twitter using the #120trade hashtag)
T2108 Status: 27.6%
VIX Status: 22.0%
General (Short-term) Trading Call: Hold but keep VXX calls in the holster. (click here for a trading summary posted on twitter)
Reference Charts (click for view of last 6 months from Stockcharts.com):
S&P 500 or SPY
SDS (ProShares UltraShort S&P500)
U.S. Dollar Index (volatility index)
VIX (volatility index)
VXX (iPath S&P 500 VIX Short-Term Futures ETN)
EWG (iShares MSCI Germany Index Fund)
CAT (Caterpillar)
Commentary
Maybe traders are taking money out of stocks and saving up for the hundreds of millions of shares Facebook (FB) will rain down on the market in Friday’s IPO. I find it ironic that as the Facebook IPO gets ever more valuable and pricey, the general market is sinking and limping. Either Facebook is going to save the market by catalyzing a nice oversold bounce on Friday, or Facebook will fire off the last rockets we see for the summer. For now, I am betting on the former, but the bears are starting to win the argument…
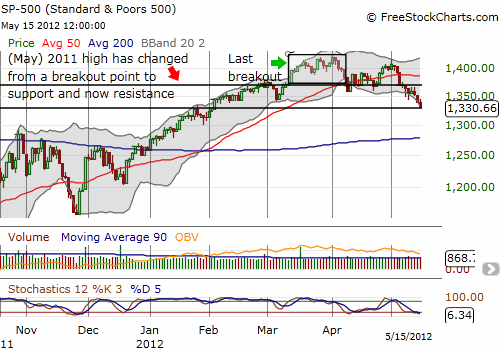
I figured T2108 might hit oversold today, but it only nudged down to 27.6. Granted, the S&P 500 only lost 0.6%, but given the number of breakdowns I see in stocks, I figured the index was not telling the whole story. Regardless, the momentum is firmly pointing downward as the market has fallen from the “edge.” The S&P 500 has now essentially erased all its gains from the breakout on February 3rd. The S&P 500 has now gone from a double-digit gain this year to a 5.8% gain. Stochastics are now almost as oversold as they were in the swift swoon in late November.

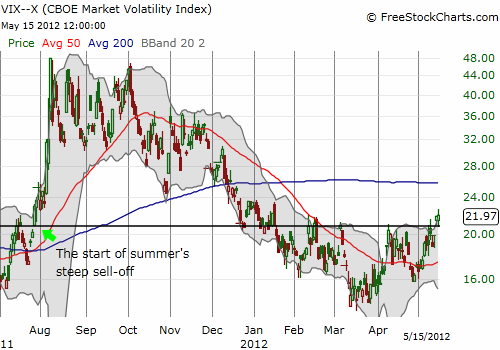
Even more importantly, the volatility index, the VIX, has finally broken out above the critical 21 level. This point marked the beginning of last summer’s swoon. Consider this our first deep red warning. I am all in favor of buying some out of the money calls on VXX here just in case we get something big just like early August. Until the VIX comes back down, VXX is officially a buy. If I had been paying closer attention at the close today, I would already have a fistful of VXX calls in the T2108 portfolio right now. Instead, I have wilting puts!

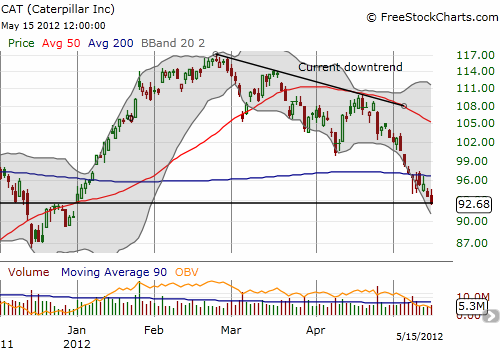
My industrial bellweather, Caterpillar (CAT), is now just one year-starting gap away from erasing all its gains for 2012.

Ultimately, foreign exchange will be our guide on what to expect. As long as the euro is sinking like a stone, I cannot expect the market to bounce much, if at all. (See “A Sinking Euro Sets Up Franc Strength And Bargain German Stocks” for more discussion about the euro).
Needless to say, I now see danger in the market everywhere even as I salivate over picking spots in an oversold market. When the next bounce comes, I firmly expect former support at the May, 2011 highs and last big breakout to become strong resistance, especially given the current accumulation of bearish signals. (See “Chart Review: Apple Breaks First Critical Support As Downtrend Continues” for a bearish look at Apple’s (AAPL) stock chart).
(Note – as of May 11, 2012, some glitch in FreeStockCharts.com is screwing up the overlay of the S&P 500 with T2108).
Black line: T2108 (measured on the right); Green line: S&P 500 (for comparative purposes)
Weekly T2108

*All charts created using freestockcharts.com unless otherwise stated
Related links:
The T2108 Resource Page
Expanded daily chart of T2108 versus the S&P 500
Expanded weekly chart of T2108
Be careful out there!
Full disclosure: long SDS; long VXX put, long CAT shares and puts, long SSO calls, short EUR/USD

