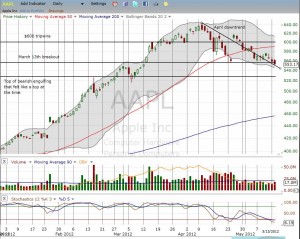
On Friday, May 4, Apple, Inc. (AAPL) essentially filled its post-earnings gap up. It took another week for AAPL to retest support that had held in the days before earnings. The selling into that test formed a downtrend in April that Apple has yet to shake. This downtrend has been so persistent that Apple has now broken through the support that represents the March 13th breakout. As a reminder, it was on this day that the S&P 500 broke out to eventually set new multi-year highs. The chart below summarizes the technical setup.
Click image to get a larger view…

Source: FreeStockCharts.com
Note well that Apple is now very oversold on its stochastics – even more oversold than it was right before earnings. The only good thing about the continued slide is that trading volume remains below average and well below pre-earnings volume. I continue to think that Apple is suffering from a lack of buying interest. Once Apple reaches some “agreeable” support level, buyers should quickly snatch up shares again. I am guessing that the next spot that might interest buyers is around $527 which served as the former all-time high that Apple hit when it made a bearish engulfing top that looked pretty devastating at the time. If $527 fails, then perhaps $515, the low of the March swoon, could serve as firmer support. After that, it will be the 200-day moving average (DMA)! I am not yet ready to wrap my mind around THAT possibility.
Be careful out there!
Full disclosure: long AAPL calls and puts, long SDS, long SSO calls
