(This is an excerpt from an article I originally published on Seeking Alpha on May 7, 2012. Click here to read the entire piece.)
After the S&P 500 (SPY) dropped as much as 0.4% on Monday, April 30, 2012, I decided to take a shot at trading what seemed to be the double whammy of technical trades: the tendency for Tuesday’s to trade up and the tendency of the beginning of the month to trade up. {snip}
It turns out that the Tuesday anomaly was not just special to 2011, it has been special since at least 1950.
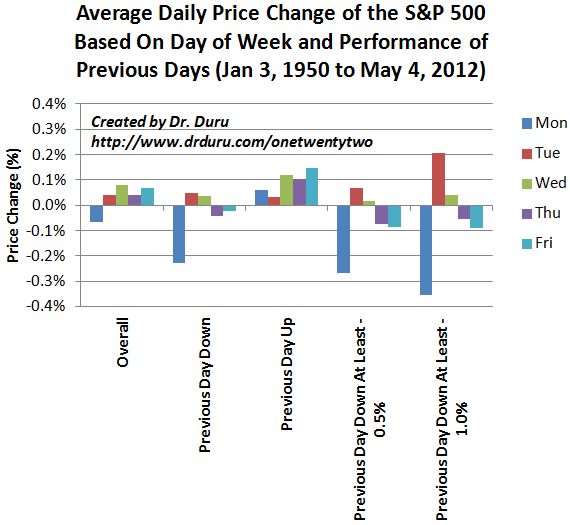
There are many things to notice in this chart, so I will list them in bullet point form after defining the chart’s elements.
{snip}
Some immediate observations:
- The overall average daily performances are all very small, well within a band of -0.1% to +0.1%. {snip}
- Mondays trade at a near consistent disadvantage to all other days of the week across categories.
- Tuesdays outperform all other days when the previous trading day closes with a loss. This outperformance appears to grow the greater the sell-off in the previous trading day.
- {snip}
{snip}
{snip}… you are not likely to build a consistently winning trading strategy year-in and year-out simply trying to play the overall averages. For example, since 2007, Tuesday has only delivered outperformance in two years: 2008 and 2011.
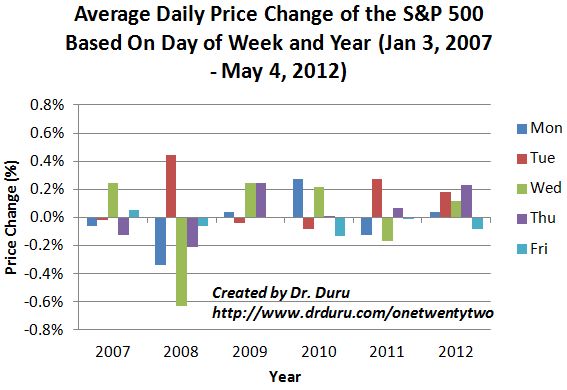
{snip}
The next charts break down the data segments by year covering 2007-2012. Again, note well that the relationships across the days of the week can change dramatically from year-to-year. {snip}
I will say that the small amount of data for 2012 seems to suggest that the “Tuesday trade” is only reliable if Monday closes down…but not too low. Wednesday is this year’s more reliable recovery day. {snip}
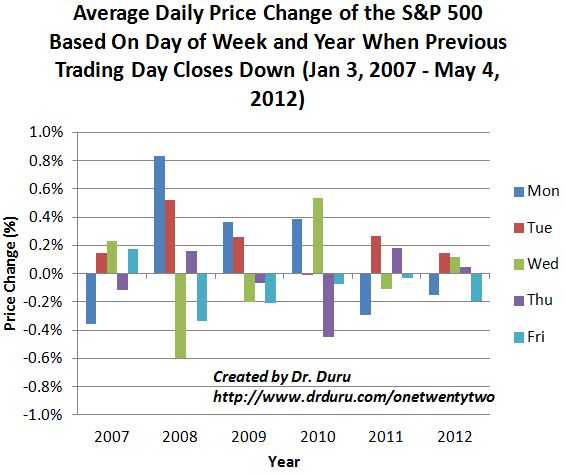
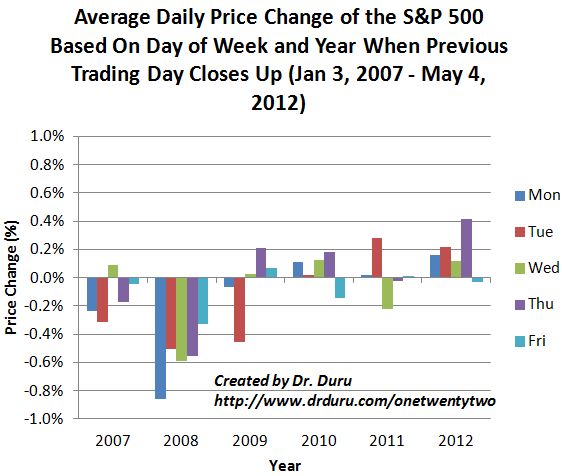
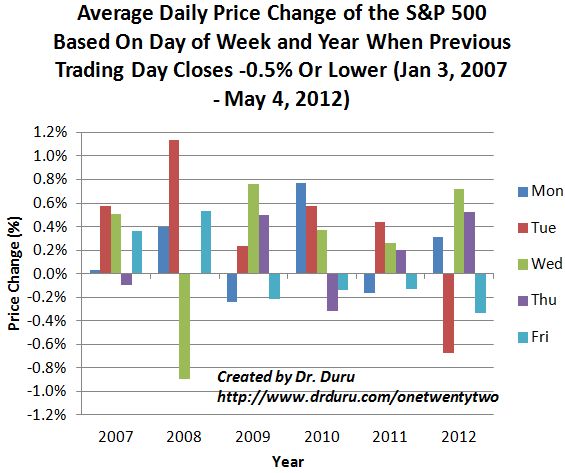
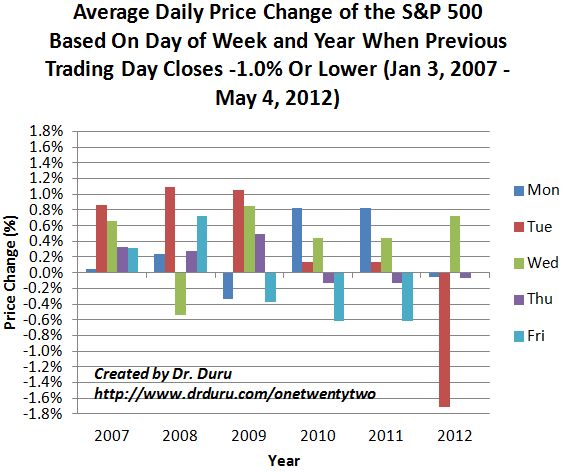
The strong rally of 2012 has not yet generated many large down days. To date, there have been 12 trading days closing with a price change of -0.5% or lower and only 5 trading days closing with a price change of -1.0% or lower. No Thursday has yet closed with a price change of -1.0% or lower.
Be careful out there!
(This is an excerpt from an article I originally published on Seeking Alpha on May 7, 2012. Click here to read the entire piece.)
Full disclosure: long SDS
