(T2108 measures the percentage of stocks trading above their respective 40-day moving averages [DMAs]. To learn more about it, see my T2108 Resource Page. You can follow real-time T2108 commentary on twitter using the #T2108 hashtag. T2108-related trades and other trades are posted on twitter using the #120trade hashtag)
T2108 Status: 39%
VIX Status: 19%
General (Short-term) Trading Call: Hold. (click here for a trading summary posted on twitter)
Reference Charts (click for view of last 6 months from Stockcharts.com):
S&P 500 or SPY
SDS (ProShares UltraShort S&P500)
U.S. Dollar Index (volatility index)
VIX (volatility index)
VXX (iPath S&P 500 VIX Short-Term Futures ETN)
EWG (iShares MSCI Germany Index Fund)
CAT (Caterpillar)
Commentary
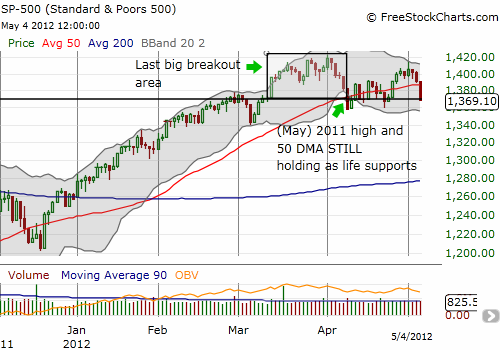
I have not written a T2108 Update in a little over a week. At that time, it seemed bulls were finally regain momentum. The S&P 500 was launching off critical support that kept the index within its breakout territory and following the 50DMA trend upward. Since then, the S&P 500 stalled, making little progress. On Tuesday, the stock market began the month with a strong rally that generated fresh multi-year highs for the Dow Jones Industrial and took the S&P 500 close its own multi-year highs. It has been all downhill since. The current selling seems to be flagging a topping pattern with this week delivering the first lower high of the 2012 rally.

Traders must assume that the S&P 500 has now printed a lasting top. Such a top would be consistent with another scramble to sell in May (see my last “sell-in-May” analysis in “If You Must Sell In May, Choose The Start Or The End Of The Month“). Only fresh highs will break this latest bearish spell.
Note well that this pattern does not mean trading will become instantly easy for bears going forward. The market has now gone nowhere for two months, churning up and down, providing alternating periods of chills and thrills. This could very well continue for weeks more. T2108 now sits at a very neutral 39%, so it provides no directional guidance. I expected it to trip overbought this past week in time for selling in May, but T2108 only got as high as 60% on May 1. I now switch my forecast to expect oversold conditions before overbought conditions occur again. The bounce from oversold conditions could be relatively sharp and deliver some brief upward momentum as some bears get caught scrambling to close out short positions. However, my overall bias is now officially bearish. That is, I no longer expect a break to new 52-week (multi-year highs) anytime soon. While I have no downside target, I will be looking to fade rallies and aggressively trade against stocks retesting resistance levels or breaking critical support.
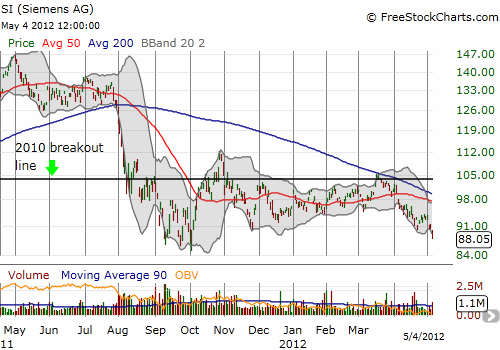
I have posted chart reviews on stocks that all look very vulnerable here: YELP, BIDU, and SFLY. There are many others. I closed out a put on Siemens (SI) on Friday. It made sense as fears of European recession constantly grow. This is an example of a change in my thinking. Previously, I was looking for opportunities to buy into Europe’s malaise. I now think the odds favor the other side until at least the market delivers another crescendo of selling. The chart below shows how much Siemens is suffering as it breaks to prices last seen close to October’s lows. The rapidly declining 200DMA is likely to combine with the 50DMA to provide firm resistance for months to come.

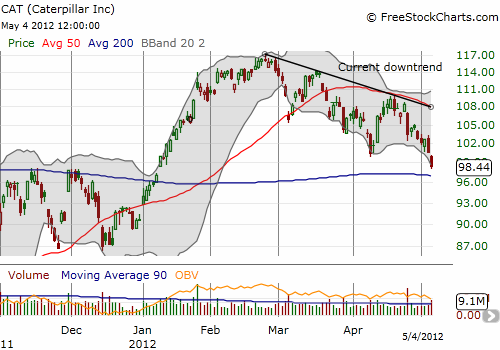
My Caterpillar (CAT) watch is also confirming bearish undertones. CAT failed to generate fresh excitement after its last earnings. It is now trading below $100 and seems certain to retest its 200DMA. I doubt this test will succeed as CAT seems destined to eventally give up all its gains for the year.

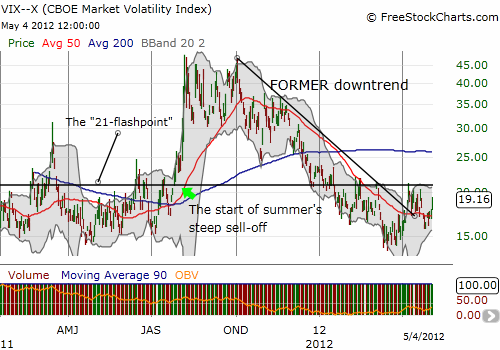
The volatility index, the VIX, may be the last piece of the puzzle. The VIX has been making a slow comeback since I last wrote the T2108 Update. The VIX has been stymied by resistance around 21 for most of this year. A break above that level will open the floodgates for bearish sentiment. This level was the flashpoint for a lot of the drama in 2011. It last broke to the upside in late July…and we know what happened after that!

Friday’s pop allowed me to exit a position in VXX May 4 calls with a very slight profit. I am still holding a put in VXX, but my bias for future trades rests firmly with VXX calls now.
Black line: T2108 (measured on the right); Green line: S&P 500 (for comparative purposes)
Weekly T2108

*All charts created using freestockcharts.com unless otherwise stated
Related links:
The T2108 Resource Page
Expanded daily chart of T2108 versus the S&P 500
Expanded weekly chart of T2108
Be careful out there!
Full disclosure: long SDS; long VXX put, long CAT shares and puts

