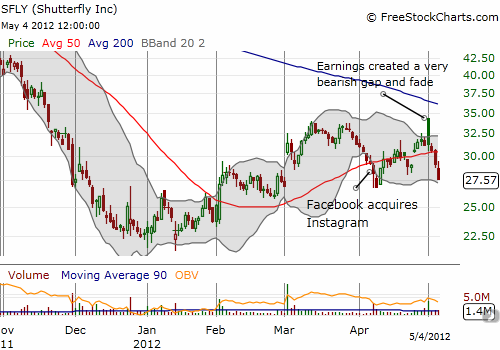
When Shutterfly (SFLY) reported earnings on April 30th, the company provided guidance for a larger Q2 loss than analyst expectations. Despite this disappointment, the stock opened the next day with an amazing 9% gain. Unfortunately, trading has been all downhill from there. SFLY closed the day losing all its gains, and it was even trading at a loss for a brief moment as it retested support at the 50-day moving average (DMA). Selling volume has continued for the three days since then. SFLY is now challenging the April lows caused by Facebook’s acquisition of SFLY competitor Instagram. There is very little support in the stock from there until the 52-week lows carved out in January of this year.

Source: FreeStockCharts.com
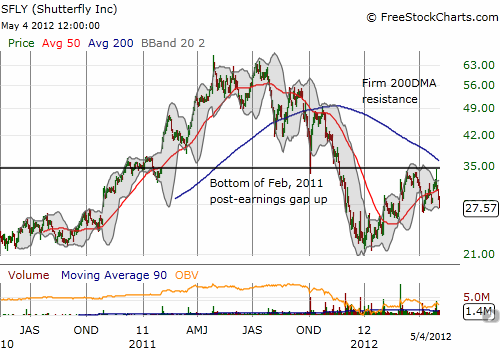
Zooming out, SFLY seems to carry a particularly ominous-looking chart. On February 3, 2011 SFLY gapped up 18% after reporting earnings that got analysts extremely excited. Price targets were raised significantly after SFLY guided first quarter and full-year fiscal earnings above consensus. In less than three months, the stock almost doubled. After retesting those all-time highs in July, SFLY has slowly but surely sold off. This has created a domed pattern that has all the looks of a significant top. The reaction to SFLY’s last earnings report seems to confirm that top as the post-earnings rally stopped cold right at the bottom of the Feb, 2011 post-earnings gap. Very ominous indeed.

Source: FreeStockCharts.com
Be careful out there!
Full disclosure: no positions
