(T2108 measures the percentage of stocks trading above their respective 40-day moving averages [DMAs]. To learn more about it, see my T2108 Resource Page. You can follow real-time T2108 commentary on twitter using the #T2108 hashtag. T2108-related trades and other trades are posted on twitter using the #120trade hashtag)
T2108 Status: 32%
VIX Status: 18.8%
General (Short-term) Trading Call: Hold. (click here for a trading summary posted on twitter)
Reference Charts (click for view of last 6 months from Stockcharts.com):
S&P 500 or SPY
SDS (ProShares UltraShort S&P500)
U.S. Dollar Index (volatility index)
VIX (volatility index)
VXX (iPath S&P 500 VIX Short-Term Futures ETN)
EWG (iShares MSCI Germany Index Fund)
CAT (Caterpillar)
Commentary
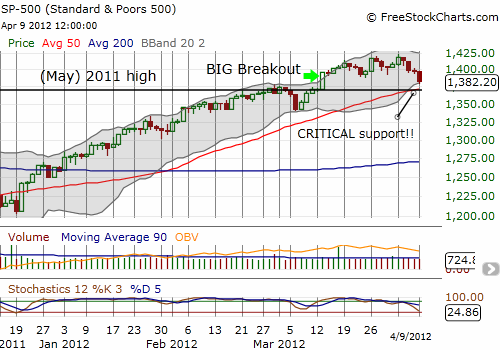
It has been almost 4 months since T2108 has been this low. On December 19, 2011, T2108 closed at 29% and ended an eight-day slide in the S&P 500. The index has since not even come close to that 4.6% loss. The current 4-day sell-off has generated a 2.7% loss and is now the largest correction of 2012. The sharp 3-day correction in March generated a 2.3% loss. T2108’s plunge confirmed the end of T2108’s uptrend from the August, 2011 lows. Additionally, stochastics are at their lowest point of the year and reaching December’s lows (see chart below). By these measures, the stock market is essentially oversold even though T2108 is still 12 percentage points away from official oversold levels.
The chart below shows that the current sell-off has also brought the S&P 500 to a critical area of presumed support. Current prices hover directly above the S&P 500’s 50DMA AND last year’s multi-year high which served as a springboard for March 13th’s big breakout. The market has wiped out the last two breakouts; the March 13 breakout stands as the last divide between bulls and bears. To-date, I have assumed that this divide would serve as the lower bound of an extended trading range. That assumption is getting tested!

On the bearish side, on-balance volume (OBV) has not advanced in the almost four weeks since the big breakout. The reversal of all these breakouts certainly ends the S&P 500’s upward momentum. The bulls have lost advantage and will need a catalyst soon to prevent the bears from seizing the momentum.
This critical juncture is also a good time to re-examine the fundamental bullish case that is based on the afterglow from 2012’s strong start with a historic, extended overbought period. First, note that T2108 was last overbought on March 13th, the big breakout day, for just one day. Since that overbought period ended the next day, T2108 has plunged 30 percentage points yet the S&P 500 is down only -0.7%! The S&P 500 was essentially flat when T2108 tumbled 10 percentage points to end the last overbought period. In other words, the index is led by some strong stocks.
This performance 18 days post-overbought is well within historic norms. If this period stretches out another 7 or so trading days, we can expect the S&P 500 to lose another 1-3% or so. Assuming T2108 will drop into oversold territory by then, we cannot expect much more downside until this period stretches out at least 50 total trading days. At this point, the expected potential downside jumps from around 5% to as much as 20%! Without dropping into oversold territory, the maximum potential loss is around 6% no matter how long T2108 avoids its next visit to overbought territory. These stats define the likely opportunity space for bears. So, how about the bulls?
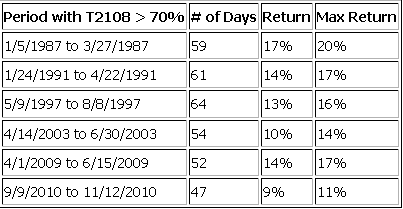
For the bulls, everything starts with the context of the historic overbought period that launched 2012. At 47 days in duration, it was the eighth longest since 1986. These top eight extended overbought periods stand apart from all the others in the extreme right tail of the distribution, so I review them as a group. Here are the top seven:

The maximum and net returns for 2012’s extended overbought period were 7.6% and 6.8% respectively – the weakest of the group (I have not yet decided whether that fact is meaningful or significant!).
The last two extended overbought periods were in 2009 and 2010. After each episode, the S&P 500 resumed its upward thrust after a month of selling and churning. 2012’s historic overbought run ended March 5th, so if recent history is any guide, the index has coiled its springs and is ready to start a new uptrend – just in time at critical support. The next comparable overbought period ended June 30, 2003. This was the aftermath of historic (at the time) lows that were set July, 2002 and retested in March, 2003 (with the start of the invasion of Iraq). The S&P 500 took a little over a month of additional churn before the uptrend resumed (click here for a chart of the S&P 500 for 2003). Notice a pattern? If the bulls are going to make a stand it should be right around here. With official oversold territory right around the corner, I am sticking with the (hedged) bullish case. If T2108 drops into oversold territory, I will be buying aggressively and dumping SDS shares and VXX calls.
The top three overbought periods occurred in 1987, 1991, and 1997. I think those are too far away in the past to draw strong parallels but note well that only in 1987 did the market experience a significant sell-off following an extended overbought period. The 1990s was an exceptionally bullish period that started with a major sell-off in 1990 that immediately preceded the 1991 overbought run. The strong sell-off in 1998 came a full year after 1997’s overbought run. Even then, the S&P 500 “only” returned all its gains AFTER the overbought period before resuming its run-up into 2000.
Oh, and the urge to sell in May? Note the specific dates of these overbought periods. Three of them crossed May. Even where 1991’s extended overbought period ended in April, summer trading never violated the May low (click here for a chart of the S&P 500 in 1991).
No matter how things turn out in the coming days and weeks, I have learned some more valuable lessons over the past month. I had to fight through my queasiness to adapt and change my strategy from being a stubborn bear through the entire overbought period. Remarkably, all but one of my flips in and out of SSO calls were profitable. The one exception occurred last week as I experimented with selling calls against a profitable position. The record of buying puts on VXX was more mixed due to longer holding periods. The record of trading in and out of individual stocks was decidedly mixed and delivered yet another reminder of how much easier it is to execute T2108 trades using the indices. I was hoping to get more time to “catch up” for my bearish recalcitrance to start 2012, but I am very encouraged with what I was able to accomplish even as the S&P 500 performed flat overall. I expect to continue learning more lessons. My consistent and persistent bottom-line is to stick to what the data tell me to do, not my emotions. I need to further fine tune when and how to get aggressive and by how much.
Finally, currency actions present the largest wildcard for T2108 trading going forward. As I noted in my last T2108 update, the extreme correlation between the USD/JPY (U.S. dollar vs Japanese yen) currency pair and the S&P 500 has flashed a major bearish signal (see “Bearish Implications Of A Rare Convergence Of Extremes In Yen Vs. S&P 500 Correlations“). Foreign exchange is likely to lead any bearish (or bullish!) catalysts as currencies should respond relatively quickly to the market’s ever-changing sentiments toward economic prospects.
In other words, stubbornly sticking to assumptions and biases should continue to prove costly. Staying nimble and flexible will maximize profit opportunities. Stay tuned!
Charts below are the latest snapshots of T2108 (and the S&P 500)
Refresh browser if the charts are the same as the last T2108 update.
Black line: T2108 (measured on the right); Green line: S&P 500 (for comparative purposes)
Weekly T2108

*All charts created using freestockcharts.com unless otherwise stated
Related links:
The T2108 Resource Page
Expanded daily chart of T2108 versus the S&P 500
Expanded weekly chart of T2108
Be careful out there!
Full disclosure: long SDS; long SSO calls; long VXX calls and puts

