(T2108 measures the percentage of stocks trading above their respective 40-day moving averages [DMAs]. To learn more about it, see my T2108 Resource Page. You can follow real-time T2108 commentary on twitter using the #T2108 hashtag. T2108-related trades and other trades are posted on twitter using the #120trade hashtag)
T2108 Status: 79% (overbought day #6)
VIX Status: 20.7
General (Short-term) Trading Call: Close more bullish positions, begin/expand bearish positions
Reference Charts (click for view of last 6 months from Stockcharts.com):
S&P 500 or SPY
SDS (ProShares UltraShort S&P500)
VIX (volatility index)
VXX (iPath S&P 500 VIX Short-Term Futures ETN)
EWG (iShares MSCI Germany Index Fund)
Commentary
T2108 moved closer to rarefied territory with a close at 79% and a sixth straight day in overbought territory. T2108 is now on the “top side” of the median overbought duration of 5 days but still under the average of 9 days. Meanwhile, the S&P 500 closed up 0.9% yet still not quite at a new 4-month high. Cracking this new high will have many levels of significance:
- Create a breakout that suggests buyers will stampede into the market.
- Break the psychologically important 1300 level on the S&P 500.
- Erase ALL the losses that started with the gut-wrenching swoon in August.
A strong on-balance volume (OBV) for the S&P 500 also supports the blossoming giddiness in the stock market.
However, given the market is getting extremely overbought (stochastics are already VERY overbought), I am much more excited about the better prices I get for expanding my bearish T2108 position for THIS cycle. A breakout move may indeed signal something important developing for a sustained rally over time, but I will revisit that possibility only after T2108 drops out of overbought territory and/or it passes the 20-day duration in overbought territory.
The signals in the market remain mixed. As I pointed out in the last T2108 update, sentiment indicators are telling contrasting stories: very low levels of bearishness and a continued migration out of equity funds into bond funds. For individual stocks, I am seeing decent to impressive recoveries from certain stocks that suffered big sell-offs in December like Oracle (ORCL), Salesforce.com (CRM), VM Ware (VMW), and even Whirlpool (WHR). In the last week, stocks like Acme Packet (APKT) and Children’s Place (PLCE) have found buyers off gaps right from the open. Speculative fever can be seen in the sudden ramp of stocks like Netflix (NFLX), up 38% already this year, and hapless First Solar (FSLR), up 15%.
These reactions tell me that whatever buyers remain in the market, they are more confident in a sustained rally and are trying to participate at relatively cheaper prices. This behavior reminds me that this is a market of stocks and individual stories can always trump the larger technical picture. This is one of the BIG reasons I stopped playing individual stocks for T2108 trades. I have also written in earlier previous T2108 updates about how I stay flexible in trading ad investing by maintaining multiple trading views and time horizons at the same time (most importantly, I love bargains at any time).
The DANGER is that as soon as the musical chairs stop in the general stock market, these very same stocks can experience some of the sharpest selling as recent buyers rush to lock in profits, reminding us they are crowded with traders, not investors. When I make these kinds of plays, I use T2108 to start selling ahead of the rush (darn those traders, especially the technical traders!).
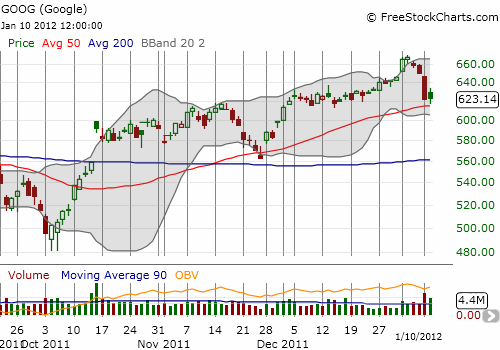
Even as bargain hunters scrape for scraps, stocks that were high-flyers going into 2012 are stumbling. My favorite to watch now is Google (GOOG). GOOG closed 2011 at $645.90 a near FOUR-year high. The stock even opened the year with a celebratory 3% one-day gain. Since then, GOOG has dropped back to its 50DMA after a surprising 4% one-day drop on Monday.

If the market were not overbought, I would suggest making a bullish trade on GOOG for a successful retest of the 50DMA and a continuation of the trend.
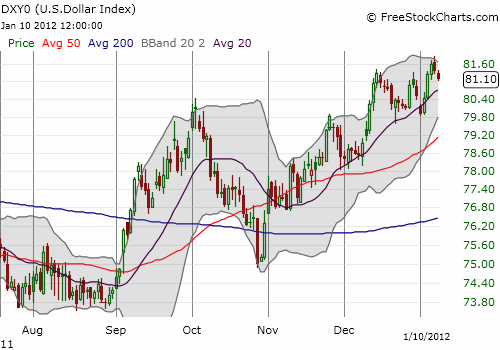
Two things ARE sure in the current environment: 1) the U.S. dollar remains strong in the near-term (conversely, the euro remains very weak), and 2) volatility continues to fall. My forex trades continue to follow the strong dollar (and weak euro) for now but only in briefly held positions. The drop in volatility is killing the VXX component of my T2108 portfolio; I will likely stop using this index in the future, especially since I firmly believe its ultimate trajectory will be to resume the death march that has dominated the vast majority of its existence. Anyway, the strong dollar is working against the assumption that the S&P 500 needs a weak U.S. currency to stay aloft. At some point, someone is going to cry uncle. I am still betting that cry will come from the S&P 500.

For better context for my interpretations of this overbought cycle, please review “Trading Strategies for an Overbought S&P 500 Using the Percentage of Stocks Trading Above Their 40DMAs (‘T2108’)“. Even scanning the charts there should be very helpful if you are a new reader.
Charts below are the latest snapshots of T2108 (and the S&P 500)
Refresh browser if the charts are the same as the last T2108 update.
Black line: T2108 (measured on the right); Green line: S&P 500 (for comparative purposes)
Weekly T2108

*All charts created using freestockcharts.com unless otherwise stated
Related links:
The T2108 Resource Page
Expanded daily chart of T2108 versus the S&P 500
Expanded weekly chart of T2108
Be careful out there!
Full disclosure: long SDS; long VXX calls and puts; long ORCL, long WHR shares, calls, and puts; long APKT calls and puts; long NFLX puts; long FSLR shares and puts, net long the U.S. dollar, net short the euro


dr d…thought you would appreciate this partial xcimment from a friend I emailed your blog to a while back……..”If you recall T2108 I’ve been following this on stocktwits #T2108 http://drduru.com/onetwentytwo/ where DrDURU updates this daily – it’s a good tool to watch, thank you very much.” that goes for me too……
Thanks for the feedback! I am always happy to hear about people who find my musings useful. 🙂