(T2108 measures the percentage of stocks trading above their respective 40-day moving averages [DMAs]. To learn more about it, see my T2108 Resource Page. You can follow real-time T2108 commentary on twitter using the #T2108 hashtag. T2108-related trades and other trades are posted on twitter using the #120trade hashtag)
T2108 Status: 59%
VIX Status: 26
General (Short-term) Trading Call: Hold
Commentary
(Note: click links for stock charts or refer to previous T2108 update for details on technical resistance and support levels)
Looks like I am back to waiting. Both T2108 ad the S&P 500 recovered almost all their one-day losses from Thursday. I was betting on at least a 1-2 day follow-through to Thursday’s selling which seemed to confirm all the bearish signals leading up to that point. Now, the S&P 500 is back to resistance. With each day it loiters around resistance, the likelihood increases that the index will find the wherewithal to surge upward and onward. The HUGE caveat to that scenario is that it will occur with T2108 stumbling into overbought territory, making any ensuing rally fraught with downside risk.
The VIX was clobbered. The volatility index tumbled 14% to 26, covering in one day the tightening band between the “magic number” of 30 and support at the 200DMA. This result snatched away my profits in my VXX calls. Two out of the last 3 rounds with VXX calls I have watched profits disappear trying to bet on at least a 1-day extension of volatility. When it gets harder and harder to make money on carefully planned positions, I start assuming the sweet spot is coming to an end…or at least the risk/reward is turning against me.
In this case, with only three weeks left in a month full of holiday cheer, I have to assume that it is highly unlikely the market will get jolted with another volatility-inducing catalyst during this time. So, while I will hold onto SDS and VXX shares for now, I am operating as if trading is essentially finished for the year. I will of course continue monitoring the market and writing about it, but my expectations for trading opportunities are very low at this juncture. Even if (when?) T2108 gets overbought, I expect complacency, market fatigue with headlines, etc…, to suppress any tendency for sellers to to push T2108 back down…until batteries are recharged for January. Under this scenario, bulls will dominate simply by default.
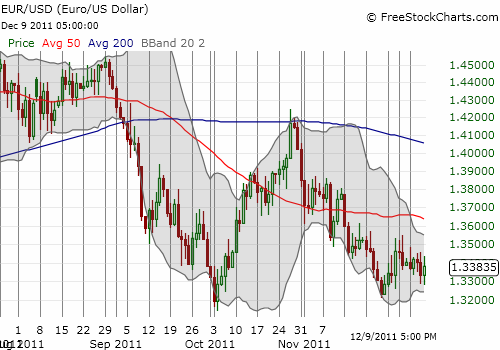
As an example of fatigue, I zoomed out from the intraday inspection of the euro to a daily view. From the EUR/USD chart below you would hardly suspect that tensions dominated trading from day-to-day. You certainly would not conclude that anything was happening to determine the ultimate fate of the currency…or even that anything definitive just happened. The euro still has not cracked new 52-week lows, and it is floating in a three-week trading range. But it also has not soared in celebration. I see neither europhoria nor europhobia. I am still waiting…

Charts below are the latest snapshots of T2108 (and the S&P 500)
Refresh browser if the charts are the same as the last T2108 update.
Black line: T2108 (measured on the right); Green line: S&P 500 (for comparative purposes)
Weekly T2108

*All charts created using freestockcharts.com unless otherwise stated
Related links:
The T2108 Resource Page
Expanded daily chart of T2108 versus the S&P 500
Expanded weekly chart of T2108
Be careful out there!
Full disclosure: long SDS and VXX; long VXX calls; net long U.S. dollar; net short euro

