This is an excerpt from an article I originally published on Seeking Alpha on November 27, 2011. Click here to read the entire piece.)
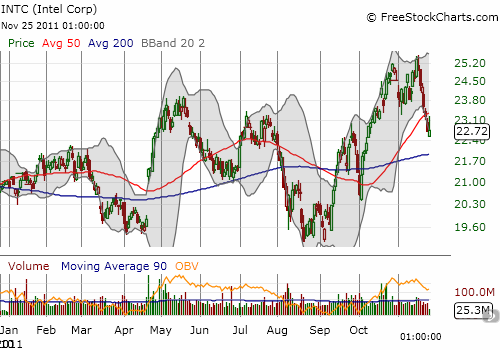
So much for putting recession fears in the rearview mirror. On October 28, I pointed to 3-year highs for Intel (INTC) as another bullish indicator among many (see “A Very Bullish Sign: Intel Breaks Out To Three-Year Highs“). These signs motivated me to project a higher trading range for the S&P 500 to close out the year. Indicators turned bearish once the S&P 500 closed below its 50-day moving average (DMA) and have worsened ever since. So, it is time to take another quick look at INTC.
{snip}

Source: FreeStockCharts.com
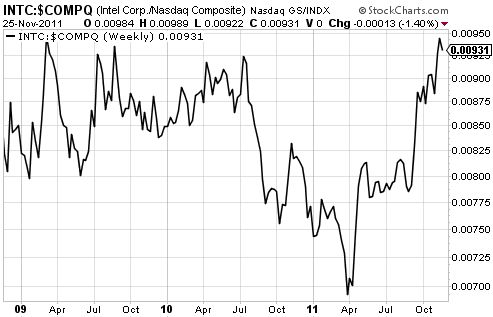
Interestingly enough, the recent out-performance is a dramatic turn-around for INTC. {snip}

Source: Stockcharts.com
Given this chart, I am assuming INTC’s out-performance versus the NASDAQ is coming to an end. {snip}
I am much more interested in the eventual opportunity for buying INTC. {snip}
I am targeting $22 as my first entry point. I will determine additional buying points as conditions unfold. {snip}
Be careful out there!
This is an excerpt from an article I originally published on Seeking Alpha on November 27, 2011. Click here to read the entire piece.)
Full disclosure: no positions
