(T2108 measures the percentage of stocks trading above their respective 40-day moving averages [DMAs]. To learn more about it, see my T2108 Resource Page. You can follow real-time T2108 commentary on twitter using the #T2108 hashtag. T2108-related trades and other trades are posted on twitter using the #120trade hashtag)
T2108 Status: 86% (fifth day of overbought period and a new 52-week high)
VIX Status: 25
General (Short-term) Trading Call: Continue closing out bullish trades. Maintain a SMALL bearish position. More details below.
Commentary
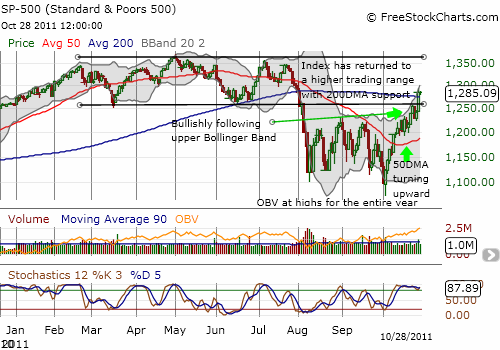
T2108 inched upward to a new 52-week high to 86%. The S&P 500 remained essentially flat and above its 200DMA after buyers stepped in following the morning’s initial selling. This close was a small victory for the bulls given T2108 AND the S&P 500 stochastics remain firmly overbought. In fact, stochastics have been overbought for almost three weeks while the S&P 500 has stubbornly pressed onward and upward. Like my late recognition of the bullish upward push of on-balance volume (OBV), I am late in recognizing that the S&P 500 is pressing a strong upward trend. The index is even following the upper Bollinger band higher. Moreover, the index is establishing a firmer foothold in the higher trading range I am now projecting to hold through at least the end of the year (after a successful test of 50DMA support).
The chart below summarizes the bullish setup.

Source: FreeStockCharts.com
Add to this bullish picture a continued descent in volatility (the VIX and VXX), Intel (INTC) breaking out to three-year highs and shaking off its status as a post-recession laggard, and Goldman Sachs apparently finally bottoming. The evidence simply continues to mount, incredibly, for a very bullish end to 2011.
All this bullishness makes formulating a short-term trading strategy even more difficult. T2108 is all about buying oversold conditions and selling overbought conditions. But in this case, overbought conditions could last for quite some time as an upward trend continues, similar to long stretches in 2009 and 2010. It is critical to avoid aggressive bearish positions until some sign of weakness appears, like a CLOSE below the 50DMA. Bullish positions still need to be reduced, but no need to dump them all.
Once the market finally experiences a pullback, figuring out a buying point becomes the next challenge. Under current bullish conditions, T2108 may not return to oversold conditions for a long time to come (I am thinking several months). Conservative traders can comfortably sit on their hands, especially if they continue to fear a coming bear market. More aggressive traders should allocate profits from previous bullish positions to tentative buys at points of support, like the 50DMA.
Note very well that my bullishness here should NOT be interpreted as suggesting that higher prices have reduced the risk of trading from the bullish side. As I have argued before, LOWER prices generate lower downside risk for bullish trades. Instead, I simply see more and more bullish signals forming and growing stronger. I am not changing any T2108 trading rules. I am accommodating these bullish signals with three small adjustments in execution:
- Maintain a small handful of bullish trading positions (similar to my recommendation to hold a few bearish positions when the bearish signals were getting stronger) unless some kind of topping signal appears.
- Only upon seeing some market weakness and/or a topping signal, expand bearish positions while T2108 is overbought.
- Use previous profits to open a few new bullish positions on tests of support before T2108 goes oversold again.
Note well that I am not forecast any particular kind of topping signal on any timeframe, but we need to ream vigilant in looking one. As a reminder, the average overbought period lasts 8.9 days and the median is 4.5 days. At 5 days and running, this overbought period is already getting long on an overall historical basis. In 2009 and 2010, T2108 remained overbought for weeks. (I will soon need to update my analysis of oversold and overbought periods for T2108).
Charts below are the latest snapshots of T2108 (and the S&P 500)
Refresh browser if the charts are the same as the last T2108 update.
Black line: T2108 (measured on the right); Green line: S&P 500 (for comparative purposes)
Weekly T2108

*All charts created using freestockcharts.com unless otherwise stated
Related links:
The T2108 Resource Page
Expanded daily chart of T2108 versus the S&P 500
Expanded weekly chart of T2108
Be careful out there!
Full disclosure: long SDS, long puts on VXX, long GS


As always, Thanks!
You’re welcome!