(T2108 measures the percentage of stocks trading above their respective 40-day moving averages [DMAs]. To learn more about it, see my T2108 Resource Page. You can follow real-time T2108 commentary on twitter using the #T2108 hashtag. T2108-related trades and other trades are posted on twitter using the #120trade hashtag)
T2108 Status: 61%
VIX Status: 32 (rose back into previous trading range)
General (Short-term) Trading Call: Hold
Commentary
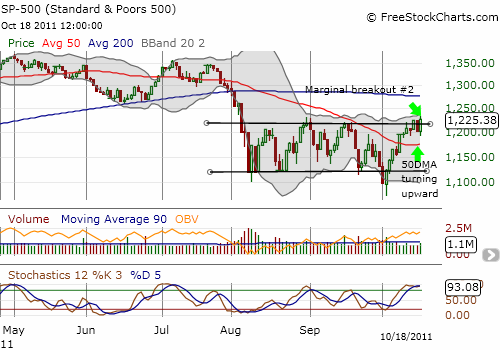
Here we go again. T2108 rebounded strongly from yesterday’s pounding and finds itself exactly where it closed on Friday. The S&P 500 moved right back into marginal breakout territory with a 2% leap right back to where it closed on Friday. A small surge in buying volume maintains the overall strength in on-balance volume.

Today’s action is a welcome relief to yesterday’s drubbing. With the 50DMA slowly but surely turning upward, I am getting incrementally more confident in my forecast that T2108 will next hit overbought territory before oversold territory. Note that stochastics remain overbought, so caution is still warranted. Moreover, the VIX did not drop back below its trading range and instead rests right at the edge. Similarly, VXX rests directly on its 50DMA. (Note that today I sold my VXX October calls after VXX turned down sharply.)
One good outcome or development for the S&P 500 would be continued churn at the top of the trading range. Such action should both work off overbought conditions and wear down the resistance at the top of the previous trading range. A subsequent breakout should take the S&P 500 to the 200DMA resistance relatively quickly.
Charts below are the latest snapshots of T2108 (and the S&P 500)
Refresh browser if the charts are the same as the last T2108 update.
Black line: T2108 (measured on the right); Green line: S&P 500 (for comparative purposes)
Weekly T2108

*T2108 charts created using freestockcharts.com
Related links:
The T2108 Resource Page
Expanded daily chart of T2108 versus the S&P 500
Expanded weekly chart of T2108
Be careful out there!
Full disclosure: long SSO, long puts on VXX

