(T2108 measures the percentage of stocks trading above their respective 40-day moving averages [DMAs]. To learn more about it, see my T2108 Resource Page. You can follow real-time T2108 commentary on twitter using the #T2108 hashtag.)
T2108 Status: 18% (2nd day of oversold conditions)
VIX Status: 41 (well below 1st day of oversold period)
General (Short-term) Trading Call: Oversold trading rules have triggered. Continue closing out bearish trades. Aggressive traders should already have initiated new positions. Conservative traders are still waiting to buy once the VIX jumps 20% or T2108 leaves oversold conditions, whichever comes first.
Commentary
A one-day bear market? We can only hope.
After today’s volatile action and strong close, I assumed that T2108 would climb out of oversold territory. Instead, it nudged upward to 18%. As a reminder, note that the majority of oversold periods last one or two days. As I describe below, a second surge wold be consistent with several converging bullish signals.
After punching through bear market territory on an intra-day basis yesterday, the S&P 500 followed through with 30 minutes of selling that took the index to fresh 52-week lows. Buyers took over from there and eventually brought the S&P flat for the day. Then, like a symmetrical relay race, sellers took over from there…until a strong burst of buying in the final 45 minutes of the trading day. See below an intra-day chart of the S&P 500 with 15-minute candles.
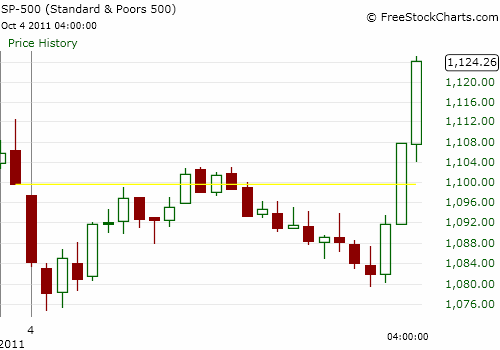
This sudden surge delivered a 2.3% gain for the S&P 500 and lifted the index out of bear market territory. Once again, it rests in the previous trading range. The daily chart suggests that the early selling represents a wash-out of sellers: a strong move down that breaks critical support (the bottom of the trading range) and/or accomplishes a major milestone (new bear market territory) only to be followed by a strong move to a higher close.
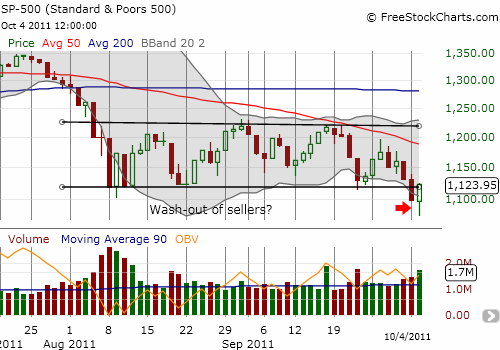
After Monday’s plunge, I claimed that shorts had it “easy” with a clear stop above the low of the former trading range. Amazingly, after just one day, the S&P 500 took out such stops. Now I find myself passing the baton to the sellers to prove themselves by breaking the S&P 500 to new 52-week lows. Until then, advantage rests firmly with the buyers again.
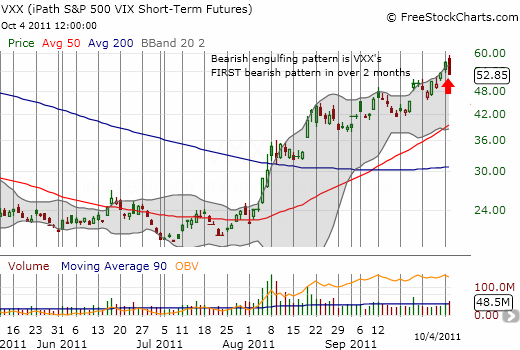
Another positive sign is that the volatility index, the VIX, was unable to break above its own trading range. Interestingly, VXX, the iPath S&P 500 VIX Short-Term Futures printed its FIRST bearish pattern in months. A bearish-engulfing pattern signals a potential top when it appears after a long upward trend.
On the sentiment side of things, I received a great link from @StockJockey via @LWinthorpe on twitter suggesting that bearish sentiment is extremely bearish amongst traders. So much so, that the trading is very consistent with major lows in 2003 and 2009. In “Rydex Ratio Reaches Significant Level” Hays Advisory notes that “Rydex traders now have over 20% more bearish assets than bullish assets.” These levels are consistent with market lows. Moreover, the VXO, the CBOE OEX volatility index, suggests that the market has already printed a major low even though markets may remain volatile for another 8-12 weeks.
Finally, I close the “preponderance” of bullish evidence by noting that hedge fund manager Doug Kass tweeted today that he has now increased his recommended equity allocation from 65% to 70%. First, I was shocked that his allocation was even as high as 65% – certainly not a portfolio positioned for a recession. Increasing it another 5 percentage points here is a pretty big deal. He had other bullish comments including a link to his latest explanation of what he sees as fundamentals that debunk recession fears – see “High Anxiety“.
For a little balance, I will end with some cautionary notes. On August 30, I used the very bullish 3-year chart on Wynn Resorts Ltd (WYNN) as proof that traders should not get overly bearish even as the market at the time hit overbought stochastics. Three weeks after that day, WYNN finally punched marginally higher…before commencing a 10-day slide that erased about a third of WYNN’s value. The chart below shows the action, including the ominous breakdown below the 200DMA. WYNN has not traded below this critical support in over two years.
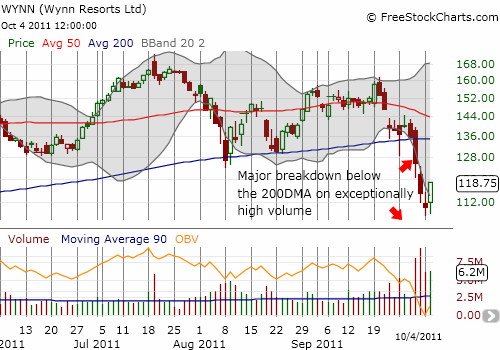
This breakdown swiftly moves WYNN from the bullish camp into the bearish camp. On rallies into resistance – like the converging 50 and 200DMAs – it makes sense to establish bearish positions in WYNN as a hedge against an otherwise bullish portfolio. If things get really ugly, WYNN has a LOT of room for falling down.
The last caution is tonight’s earnings warning from networking company Acme Packet (APKT). Afterwards, the stock traded down 15% in the after-hours session. I point out APKT because its chart mimics the chart of SPY. Clearly, sellers have not yet been washed out of APKT.
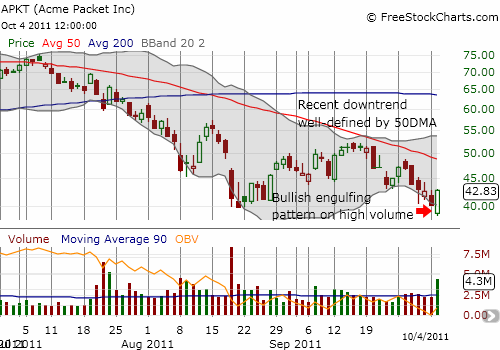
In more bullish times, APKT has bounced back quickly from these kinds of setbacks, sometimes even reversing steep losses for impressive gains on the same day. I will be watching closely how the market votes this time around. In the meantime, other networking stocks could sell-off as well. In particular, Juniper Networks (JNPR) and Cisco Systems (CSCO) are of interest given I identified and executed a pairs trade in the two – long JNPR and short CSCO. This trade may already get its first test.
Charts below are the latest snapshots of T2108 (and the S&P 500)
Refresh browser if the charts are the same as the last T2108 update.
Black line: T2108 (measured on the right); Green line: S&P 500 (for comparative purposes)
Weekly T2108

*T2108 charts created using freestockcharts.com
Related links:
The T2108 Resource Page
Expanded daily chart of T2108 versus the S&P 500
Expanded weekly chart of T2108
Be careful out there!
Full disclosure: long SSO, long VXX puts,

