(T2108 measures the percentage of stocks trading above their respective 40-day moving averages [DMAs]. To learn more about it, see my T2108 Resource Page. You can follow real-time T2108 commentary on twitter using the #T2108 hashtag.)
T2108 Status: 30%
VIX Status: 33
General (Short-term) Trading Call: Hold
Commentary
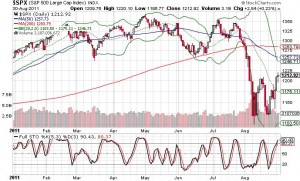
The S&P 500 ended the day flat after taking a dip in the morning that struck me as a good trading (bullish) opportunity at the time. T2108 added three percentage points to 30%, causing a nice bullish divergence with the S&P 500. This is a positive sign given the stochastics on the index are now overbought. Since the May 1st high, the index has sold off whenever stochastics got this high. I am hoping T2108’s bullish divergence softens any subsequent selling in the next day or two.
Click graphic for a larger version of the chart. Click link for the direct source.

Source: stockcharts.com
This is a good time lock in more profits from earlier oversold trades. I did not change the trading call because I am currently expecting selling to be relatively mild. If you are a daytrader, it will make a lot of sense to try shorting into any intraday rally for the next day or two. Continue tracking the VIX. It stubbornly refuses to break the last low. If this volatility index stays firm at current support, we should expect imminent weakness in the stock market.
And before you get overly bearish too soon, check out a three-year chart of gambling company Wynn Resorts (WYNN). I have also duly noted that one of my latest hedges, LinkedIn (LNKD), has soared 23% in just the past three days. The stock has rushed right up against 50DMA resistance, but it is one example of many where money has rushed right back into the stock market in search of “bargains” with high upside potential.
Charts below are the latest snapshots of T2108 (and the S&P 500)
Refresh browser if the charts are the same as the last T2108 update.
Daily T2108 vs the S&P 500

Black line: T2108 (measured on the right); Red line: S&P 500 (for comparative purposes)
Weekly T2108

*All charts created using TeleChart:

Related links:
The T2108 Resource Page
Expanded daily chart of T2108 versus the S&P 500
Expanded weekly chart of T2108
Be careful out there!
Full disclosure: long shares and calls on SSO, long VXX puts, long LNKD puts
