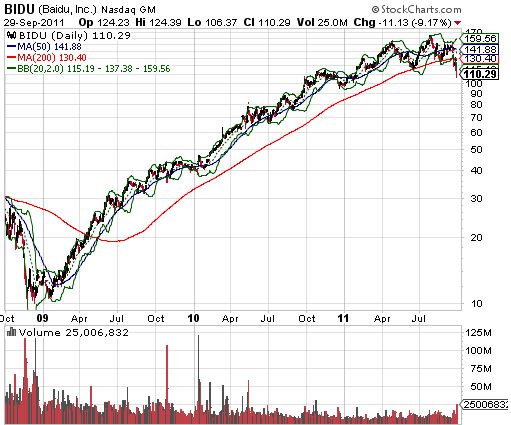
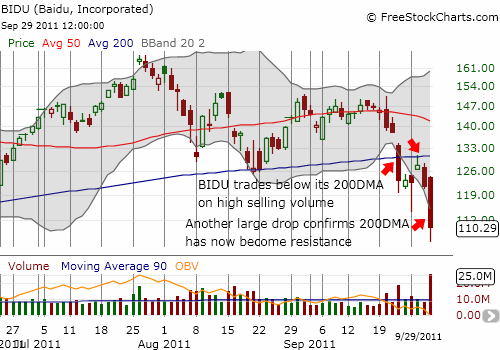
Like many strong momentum high-tech stocks, Baidu Incorporated (BIDU) has had an incredible run from its 2009 lows. In less than three years, the stock has increased over 16x from around $10 to over $160. Last week, BIDU traded below its 200-day moving average (DMA) for the first time since April, 2009. On Thursday, BIDU confirmed the breakdown and is likely to continue trading lower over time.

Source: stockcharts.com

Source: FreeStockCharts.com
The negative news flow accompanying this techncial breakdown is a Reuters report quoting Robert Khuzami, director of enforcement at the SEC, that the U.S. Department of Justice is investigating potential accounting irregularities at Chinese companies listed in the U.S. Specific companies are not named as targets, but this news casts a pall over Chinese stocks in general. Until this investigation runs its course, with specific charges announced, Chinese stocks will experience on-going valuation compression as investors scramble to price in the additional risk premium. For Bidu, the charts above confirm a significant breakdown in the stock and the potential for substantial downside from these levels.
Be careful out there!
Full disclosure: no positions
