(T2108 measures the percentage of stocks trading above their respective 40-day moving averages [DMAs]. To learn more about it, see my T2108 Resource Page. You can follow real-time T2108 commentary on twitter using the #T2108 hashtag.)
T2108 Status: 18.5%
VIX Status: 41
General (Short-term) Trading Call: Aggressive traders start buying. Conservative traders buy once VIX gains 20% over today’s close (49) or when T2108 exits oversold territory. Start closing bearish positions.
Commentary
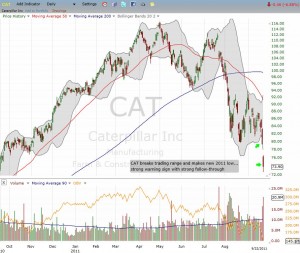
The good news is that the S&P 500 did not close at new lows for the year even after trading at its second lowest point of the year and taking just two days to travel from top to bottom of the current trading range (click link for the chart). The bad news is that a lot of other important stocks did. One of the most dramatic plunges on the day came from Caterpillar (CAT) which fell 7% to a new 52-week low.
Click on image for a larger view

Source: Freestockcharts.com
CAT is a cyclical business engaged with countries all over the globe in important industries from construction to mining. Accordingly, CAT provides a window on how investors and traders are thinking and feeling about future economic prospects. With a gap down out of the previous range, the money placed a big vote of no confidence. CAT even reaffirmed its earnings and revenue guidance during this sell-off. The 2011 lows have instantly transformed from support to resistance. Economically sensitive stocks from CSX to Peabody Energy (BTU) to Dow Chemical (DOW) took deep plunges over the last two days out of the prior trading range that defined the market’s various attempts to place the last oversold period far behind it.
Instead, T2108 is back in oversold territory, dropping about 8 percentage points to 18.5%. The VIX surged 11% to 41, but it remains within its recent trading range. Small hope that the current carnage may yet be contained.
I made several transactions in reaction to the dramatic change in technical conditions and according to the “T2108 rules” I have laid out for trading oversold conditions. I sold my shares in VXX, the iPath S&P 500 VIX Short-Term Futures, near the beginning and end of the day. I also bought a first tranche of SSO shares (Pro Shares Ultra S&P 500). For this oversold period, I will be even more focused on using ETFs on underlying indices as my overall portfolio is already positioned bullishly from the last oversold period.
As a reminder, the last oversold period lasted a historic 17 days. MOST oversold periods last no longer than 2 days. While I will not hazard to guess how long this oversold period will last, I will assume that the longer the market remains here, the more likely it signals a sustained bear market lies ahead. A break of the 2011 lows on the S&P 500 will produce the requisite 20% loss from the last highs that defines a bear market.
The T2108 Update focuses on interpreting the technical signals of the market. However, given this critical juncture, I thought I would offer up two excellent commentaries on the market, one bullish (or at least not overly bearish) and one extremely bearish.
On the bullish side is Doug Kass who has insisted for weeks that the August lows would mark the lows for the year. He appeared on CNBC’s Fast Money to once again defend his assessment. His fundamental claim is that the market is behaving as though economic growth is coming to a complete halt. He insists that all economic indicators point to a continuation of non-recessionary, slow growth, conditions.
On the bearish side is the ever-vocal Barry Ritholtz of the Big Picture. In “Look Out Below, Post FOMC Version,” Ritholtz insists that bungling on fiscal policy is sending the U.S. into Depression-like conditions a la 1937.
Finally, the strangest aspect of this sell-off is that stocks like Apple (AAPL), Amazon (AMZN), and even Chipotle Mexican Grill (CMG) all hit all-time highs just this week! Talk about a schizophrenic market! I do not know what to make of this dichotomy, but I have to believe that at least one of these stocks is in for a very nasty tumble if market negativity persists for much longer.
Charts below are the latest snapshots of T2108 (and the S&P 500)
Refresh browser if the charts are the same as the last T2108 update.
Click charts for larger views.
Black line: T2108 (measured on the right); Green line: S&P 500 (for comparative purposes)
Weekly T2108

*T2108 charts created using freestockcharts.com
Related links:
The T2108 Resource Page
Expanded daily chart of T2108 versus the S&P 500
Expanded weekly chart of T2108
Be careful out there!
Full disclosure: long SSO, long AAPL call spread, long AMZN puts

