(T2108 measures the percentage of stocks trading above their respective 40-day moving averages [DMAs]. To learn more about it, see my T2108 Resource Page. You can follow real-time T2108 commentary on twitter using the #T2108 hashtag.)
T2108 Status: 6.5% (Day #3 of the current oversold period).
VIX Status: 48.
General (Short-term) Trading Call: Close most bearish positions. Continue SLOWLY building bullish positions. (More below).
Commentary
Whether bull or bear or someone who typically does not care, you had to feel some twinge of pain watching today’s trading action. Otherwise, you must be one cold trading bot!
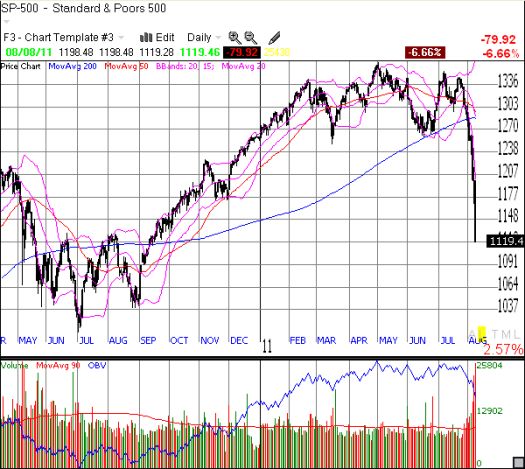
No doubt about it. Today was an epic and historical day amidst an historical sell-off. The S&P 500 fell a blood-curdling 7% (in decimals an eerie 6.66%!) to 1119.46. The index sliced right through all the potential support levels from last November and stopped at the highs from last summer. The S&P 500 is just two percentage points from a 20% loss from April’s closing highs – bear market territory.

The list of extremes in this market are long. At 6.5%, T2108 is at a level not seen since the March, 2009 lows. Since 1987, there have only been 48 trading days where T2108 has been lower. Twenty-two of these days were during the October, 1987 crash; twenty-one of these days were during the panic of 2008; only THREE of these days were around the March, 2009 epic lows. The last two of these days were during a sell-off in August, 1990.
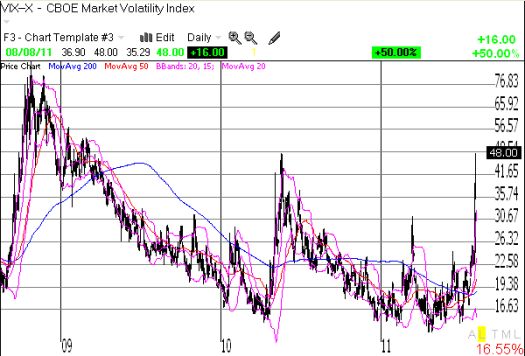
T2107 =11.5% and is also back to levels from March, 2009. The VIX spiked 50% to 48. It managed to close at its highs and match the intraday high from May, 21, 2010 which ALSO coincides with levels last seen March, 2009.

Here is a sampling of other extremes from other sources since last Friday:
From CNBC on August 5: (“Capitulation? Market Looks For Signs Selloff is Done“)
“Money market funds over the past week have seen $70 billion in redemptions, the largest since the pivotal collapse of Lehman Brothers in September 2009…
Stocks funds saw $11.2 billion in outflows, with long-only funds losing $6.5 billion, the largest since May 2010. US equities saw $8 billion in outflows. At the same time, commodities had inflows of $2.9 billion—primarily in gold funds—while bonds saw their first outflows in six weeks but at a relatively tepid pace of $1.2 billion.
Investors also bailed on municipal bonds, with an $800 million outflow marking the biggest such move since April, and safe-haven Treasurys saw inflows of $739 million”
From Bloomberg (“Investors Reduce Bullish Commodity Bets“, Aug 7, 2011):
“Bullish gold holdings climbed to the highest since at least June 2006 amid surging demand for an investment haven.”
And my favorite via a tweet from Doug Kass today:
“According to sentiment trader.com market as oversold as when Germany invaded France in 1940 and during Oct. 1987 crash.”
With all these extremes, it seems the market MUST be near some kind of a bottom, or, similarly just ahead of a strong bounce. In my last T2108 Update, I wrote at great length to argue that this is a time to focus on buying opportunities. I provided several statistics to explain how to choose a strategy for trading oversold periods. Now, we have an oversold period that is just three days old and already at extremes. This means that extreme caution is necessary going forward (especially if you have been trading with reckless abandon up to now). The focus must be on staying in the game, so you remain ready for every upcoming opportunity.
The short-term trading call advises closing out most bearish positions: anyone trying to chase stocks down with shorts and puts is likely taking the biggest risks at this point. Holding a last few bearish positions makes sense for “just in case” insurance and/or profits. Traders should continue building bullish positions albeit SLOWLY.
The opportunities are piling higher, but traders must size positions appropriately and prepare for the potential for lower prices. Another interesting aspect of these extremes is that it could make sense to sell the latest round of bullish positions the minute T2108 leaves oversold territory. However, we must take this one day at a time.
As always, you can review my trades on twitter using the #120trade hashtag. I did not take any large positions and instead chose to nibble: another VXX put when the volatility index had gained 20%, another tranche of SSO long, and more follow-through on my plans to accumulate commodity-related plays for a longer-term hold with another tranche of EWZ, the iShares MSCI Brazil Index Fund ETF, and a new position in EWA, the iShares MSCI Australia Index Fund ETF. (For a review of my overall strategy for commodities see “Preparing for Profits in a Resource-Constrained World” and “Profiting from Physical Assets in a Resource-Constrained World – Rules and Picks.” My (ironic) dilemma is that far too many commodity plays are triggering buy signals far in advance of when I thought they would. I am currently thinking through a revision of the strategy to deal with this situation.
I leave you with two videos as more encouragement to tread carefully even as you take advantage of all the opportunities this manic market offers right now.
Jon Najarian talks about how high frequency trading, the trading machines, and quote stuffing mask what is really happening on the trading floor. In early July, The exchanges’ Consolidated Quote System (CQS) had its capacity expanded by 33% to 1 million quotes per second. Yet another reason not to react to headlines.
And PLEASE do not do this…!
The Etrade Baby Loses It All… 🙁
Charts below are the latest snapshots of T2108 (and the S&P 500)
Refresh browser if the charts are the same as the last T2108 update.
Daily T2108 vs the S&P 500

Black line: T2108 (measured on the right); Red line: S&P 500 (for comparative purposes)
Weekly T2108

*All charts created using TeleChart:

Related links:
The T2108 Resource Page
Expanded daily chart of T2108 versus the S&P 500
Expanded weekly chart of T2108
Be careful out there!
Full disclosure: long shares and calls on SSO; long puts on VXX; long GLD and GG
