
(T2108 measures the percentage of stocks trading above their respective 40-day moving averages [DMAs]. To learn more about it, see my T2108 Resource Page. You can follow real-time T2108 commentary on twitter using the #T2108 hashtag.)
T2108 Status: 11% (Day #2 of the current oversold period).
VIX Status: 32.
General (Short-term) Trading Call: Close most bearish positions. Continue building bullish positions.
Commentary
T2108 dropped from 13% to 11%. At one check, T2108 reached an incredible 9%. T2107, the percentage of stocks trading above their 200DMAs, was at a breathtaking 19%. At these extremes, ever lower readings do not tell us much more information. The rubber band just gets stretched more and more.
On Friday, the rubber band snapped back, stretched, and snapped back again. It was a wild day where both the S&P 500 and the volatility index, the VIX, managed to end the day flat. The S&P 500 was up as much as 1.5% and down as much as 2.7%; this must have caused serious havoc in the options pits with the expiration of weekly options. The 1200 support line for the S&P 500 now becomes an even more important line of battle for bulls and bears. (Click here for yesterday’s chart showing resistance and support. See a current chart of the S&P 500 here on stockcharts.com).
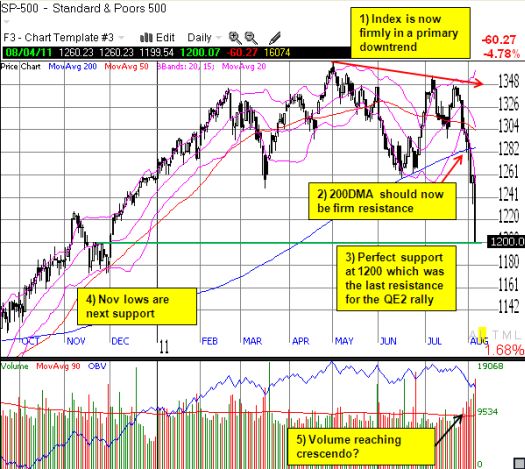
The gap up at the open seemed to validate my bullish positioning. Of course, disappointment accompanied the quick fade, but I had to quickly reorient my thinking back into a buy mode. If Thursday’s oversold extreme created screaming buys, further selling made those screams ever more insistent. I moved to purchase more SSO (ProShares Ultra S&P 500), more puts on VXX (iPath S&P 500 VIX Short-Term Futures), and several individual stocks (some adding to existing positions). It felt like the previous day all over again where there were simply too many attractive opportunities to process. I was surprised by the strong rally back to flatline, so I unloaded one of the stocks (index-related equities are my primary focus now for playing T2108) just to lock in some profits.
I provide this summary to introduce some topics I should have covered Thursday on how to trade oversold periods.
First, some lessons:
- To the extent possible, do not react to headlines. Note well that in Thursday’s T2108 update, I made no mention of the pending jobs report. I am also not referencing those numbers here or the S&P’s late Friday night downgrade of U.S. debt.
- Despite the above, respect that the market may be reacting to headlines. Quick, counter-trend reactions to news headlines are subject to strong fades. There are always a large group of traders and investors who are relieved, in this case, to get upticks to unload stocks they wish they had unloaded earlier.
- Moves that further extend the market’s extremes LOWER the risk of counter-trend trades. However, do not let growing confidence lead to over-sized positions. Confirming signals are critical to execution.
Sentiment lies at the core of these lessons. I think there is a tendency to extrapolate price momentum into risk. That is, if prices are falling, risks are increasing. When prices are rising, risks are decreasing. This method of thinking is exactly the reverse attitude required to use effectively a contrarian signal like T2108. When the S&P 500 was challenging multi-year highs just one month ago, risks to the downside were incredibly high (T2108 was of course overbought). While we enjoy higher stock prices, we cannot take comfort in them. The risks are all around and at all times, but we cycle from ignorant bliss to irrational panic and everything in between. The current price declines are just confirmation of the risks that were already present in the market. They are not necessarily the revelation of some new information. Similarly, today’s lower prices should not be feared. They represent opportunity. If you were building shorts at overbought levels, today’s prices mean great reward. If you still have cash on the sidelines, today’s lower prices mean the downside risk just got that much LOWER for putting that cash to work, and you can size your bullish positions accordingly.
T2108 can help trend and momentum traders assess risk, but it will not help much in timing the end of those trades. However, I have done a study on the typical length of oversold periods: “Trade the Oversold Bounce” (free registration required to SFO Magazine). Similarly, I have done a study on the length of overbought periods: “Using the Percentage of Stocks Trading Above Their 40DMAs (T2108) to Identify Overbought Conditions on the S&P 500.” Here are the historical statistics on oversold periods going back to 1987 as of April, 2010 (we have had three oversold periods since then):
- The average oversold period lasts six trading days.
- 31% of oversold periods last only 1 day.
- 56% of oversold periods last no more than 2 days.
- 80% of all oversold periods end in 9 days
- 90% of all oversold periods end in 10 days.
I next included an analysis of maximum drawdowns during oversold periods and the VIX to develop the following trading rules:
Lower risk tolerance (conservative traders): buy once the VIX increases 20% from the first oversold day or buy the
first day after the oversold period ends, whichever comes first.
Higher risk tolerance (aggressive traders): buy on the first oversold day.
As expected, the more aggressive strategy suffered higher drawdowns but also higher profits on the first day after the oversold period ends. I like to supplement the aggressive strategy by buying throughout the oversold period. Since the VIX was up as much as 24% on Friday, the second oversold day, BOTH strategies have been triggered. In this case, the more conservative trader would have the higher profits given the 20% trigger was near the lows of the S&P 500 on Friday.
I should also clarify that trading oversold bounces no longer uses the VIX relative to any previous oversold periods. Last year, I discovered that the VIX is actually LOWER than the previous spike in the VIX 47% of the time.
For more details, data, charts, and analysis on trading oversold periods, refer to the article.
Finally, note that my current level of aggressive bullishness is in direct proportion to the aggressive nature with which I shorted the market going into this oversold period. I was motivated both by T2108 and my expectation that the market would experience some sort of China-related calamity by September (see “Preparing for Profits in a Resource-Constrained World“). Obviously, the China part of the thesis has yet to play out. Regardless, these trades provided a lot of cash for applying to my bullish trades. As a reminder, as of Thursday, I closed out all my SSO puts and my SDS shares. I have very few puts and shorts on individual stocks left given that I have been phasing out my bearish trades ever since T2108 hit my first forecast of the lower 30s.
Do I wish I had held ALL my puts and shorts until Friday, maybe longer? Sure. However, trying to time an exact bottom is a fool’s game. All I think I know right now is that the S&P 500 is “very close” to a trade-able bottom, and I have T2108 on my side.
Charts below are the latest snapshots of T2108 (and the S&P 500)
Refresh browser if the charts are the same as the last T2108 update.
Daily T2108 vs the S&P 500
")
Black line: T2108 (measured on the right); Red line: S&P 500 (for comparative purposes)
Weekly T2108

*All charts created using TeleChart:

Related links:
The T2108 Resource Page
Expanded daily chart of T2108 versus the S&P 500
Expanded weekly chart of T2108
Be careful out there!
Full disclosure: long shares and calls on SSO; long puts on VXX
This is a very insightful and disciplined approach and article – one of the best I have read from you and one all should read.
Thanks for the kudos! Spread the link and the word! 🙂