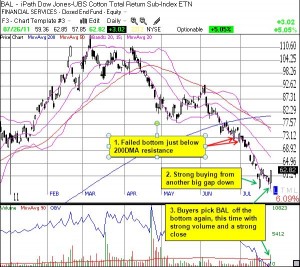
Commodities continue to exhibit a dichotomy of patterns. Some have made new 52-week (and all-time) highs as they continue to recover from June’s selling. Others, like BAL, the iPath Dow Jones-UBS Cotton Total Return Sub-Index ETN, have continued a strong sell-off. On July 18, the stock gapped down, but buyers immediately closed the gap and even matched the previous day’s high. After one more strong day, the stock slowly slipped back down for four days. BAL tested the bottom today and that brought back buyers with an even stronger showing than last week. All this action suggests that BAL is finally finding a bottom.
Click graphic for a larger image

*Chart created using TeleChart
The path ahead for BAL is NOT easy given the looming overhead resistance of a declining 50-day moving average (DMA) and a 200DMA that will surely be declining by the time BAL makes it up that high. Regardless, BAL is attractive to me as a play for profiting from physical assets, and because it is now 46% off its all-time high. It will take another 33% to erase all the post-QE2 gains, but I decided that it is worth the risk to start buying here.
(So far, bottoms that I earlier noted in LEDS, LDK, and SOL are still holding up).
Be careful out there!
Full disclosure: long BAL
