(T2108 measures the percentage of stocks trading above their respective 40-day moving averages [DMAs]. To learn more about it, see my T2108 Resource Page.)
T2108 Status: 58%.
VIX Status: 20.2
General (Short-term) Trading Call: Hold.
Commentary
T2108 dropped slightly to 58%. The S&P 500 also dropped slightly with a 0.4% loss. Most interesting is the continued rise in the VIX. At 20.2 the volatility index remains in the same range it was during June’s swoon. Again, this suggests to me that the market is at high risk of selling off, especially since T2108 just slid off the brink of overbought conditions.
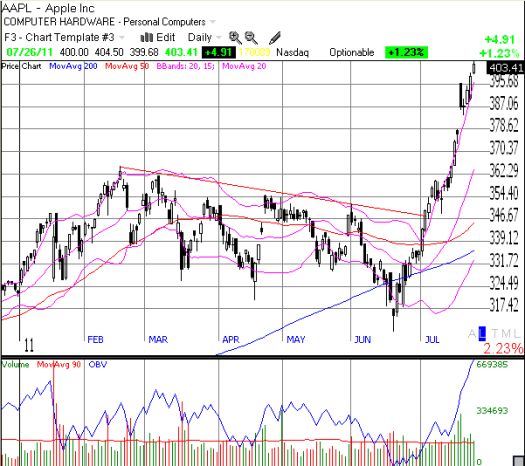
The big caveat for today’s T2108 discussion is once again Apple (AAPL). Today, the stock closed above $400 for the time ever. To me, this fully confirms that AAPL is on a new bullish run. I was not smart enough to go ahead and buy some AAPL when it broke out from its short-term downtrend three weeks ago. AAPL has gained over 10% since then on a straight line riding the upper Bollinger Band. This pattern is just about the strongest upward trend a stock can get without going parabolic.

So, as I have mentioned before, it is very difficult for me to get overly bearish while Apple is so strong. I cannot recommend overloading on trading shorts, but keeping some on hand still makes sense. In other words, the outlook is very mixed, but the risks are high enough to warrant maintaining some bearish trading positions. Oh yes, and if you have to be bullish, AAPL may be the only stock you need.
Late addition: Jon Markman tweeted the following important statistic tonight:
“Even though the Nasdaq 100 is at a 1-year high, the avg N100 stock is 12% below its high. Last similar divergence was Oct ’07. $$”
I guess that is one HUGE caveat to the caveat represented by AAPL’s bullish run!
Charts below are the latest snapshots of T2108 (and the S&P 500)
Refresh browser if the charts are the same as the last T2108 update.
Daily T2108 vs the S&P 500

Black line: T2108 (measured on the right); Red line: S&P 500 (for comparative purposes)
Weekly T2108

*All charts created using TeleChart:

Related links:
The T2108 Resource Page
Expanded daily chart of T2108 versus the S&P 500
Expanded weekly chart of T2108
Be careful out there!
Full disclosure: long puts on SSO, long SDS
