
After 46 days, the stock market finally dropped out of overbought conditions. On Friday, T2108, the percentage of stocks trading above their respective 40-day moving averages (DMAs), plunged below the 70% overbought threshold all the way to 62.5%.

The stock market had a historic run. These past 46 trading days created the sixth longest overbought period since 1986. This period outlasted the low-volume 38 days that preceded that big correction in May and fell just short of last year’s 51 days that preceded a big bear fake-out that summer.
While the drop in T2108 was large, the S&P 500’s sell-off was relatively “well-contained”; it did not meet my criteria for the big, one-day sell-off that I assumed would accompany this kind of breakdown from overbought levels. I was waiting for such a move to generate a definitive bearish signal. Instead, selling volume was merely average, and the S&P 500 remains within a strong uptrend marked by the 20-day moving average. This uptrend needs to break to confirm Friday’s bearish signs.

The S&P 500 has now given up all of the 1.9% gain from its post-Fed rally last week. Given the high buying volume on that day and how far that rally stretched the index above its upper-Bollinger Band, it remains very possible that we witnessed an exhaustion gap that sucked in the final buyers of the 2-month+ rally. Follow-through selling will seal the deal.
At the end of October, I compared this Fall’s overbought stretch to the one that ended with the big sell-off in May. At that time, T2108 dropped 9 percentage points (same as Friday!) to finally end a 38-day run with overbought conditions, and the S&P 500 lost 1.7% on above-average volume. The selling on April 30th also decisively ended the previous uptrend. Last Friday’s move was light in comparison.
In other words, hope remains for bullish wishes, but all the warning signs are tilting comfort levels to the bears.
The biggest gear propping up the bullish machinery is the Federal Reserve’s quantitative easing program. So, it is ironic that the break of overbought conditions came just as the Federal Reserve made its first purchases under this program. However, this would fit into the general theme of “selling on the news.”
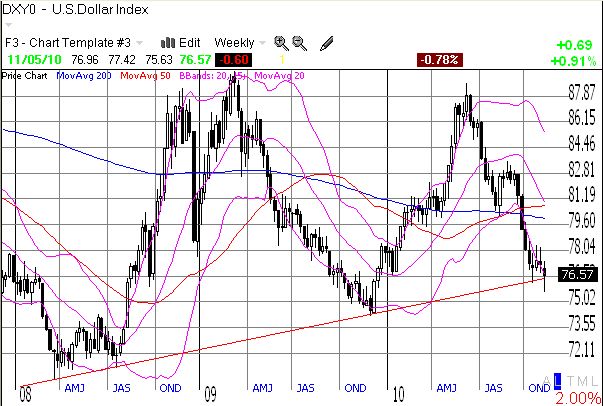
This is also a critical juncture for the U.S. dollar. The dollar has proven quite resilient against a major support line that has “everyone’s” attention since the trend reaches back to the multi-decade lows from 2008 (click here for a view of a recent weekly chart that shows this trend). The dollar has now pushed right against resistance from October. Given current trends and the simmering re-emergence of economic and monetary woes in Europe (the problems really never went away, only the market’s concern for them went away), I am expecting the dollar to eventually churn its way through this resistance on its way to another rendezvous with the 200DMA. Such a move will likely provide powerful fuel to a correction (or “cooling off”) in the commodity space. I will be treating such a move as the beginning of a, uh, golden opportunity.

*Charts created using TeleChart:

Be careful out there!
Full disclosure: long SSO puts