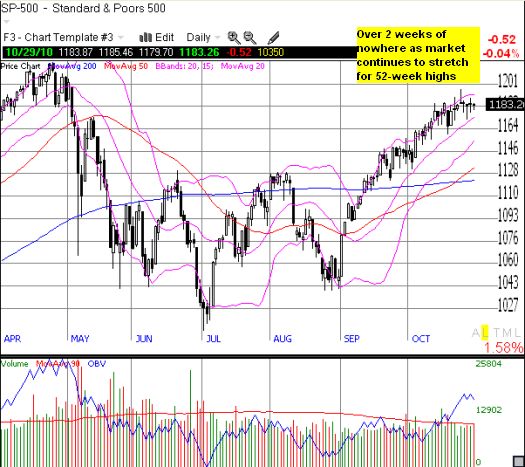
The market has essentially maintained a holding pattern while awaiting the results of next week’s trifecta of news: the elections, the Federal Reserve’s announcement on quantitative easing, and the next employment report.

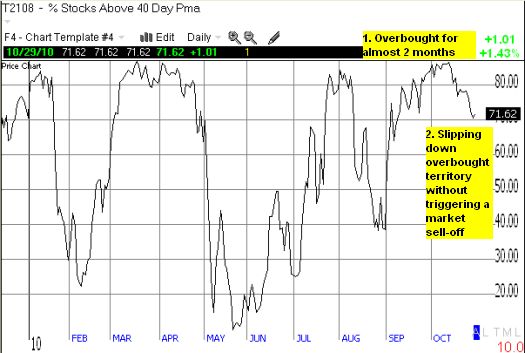
So I was quite surprised to realize that for almost three weeks my favorite technical indicator, T2108, has been dropping. On Thursday, this indicator of oversold and overbought conditions almost slipped out of overbought territory after hitting 71% – just above the 70% threshold that fences off overbought territory.

*All charts created using TeleChart:

There are two potential interpretations of this divergence, depending on your bias.
If you are bullish, you might think that this divergence means the market has yet more room to the upside to continue pushing on overbought conditions. I suspect most of the stocks that have fallen below their 40-day moving averages (DMAs) have been slammed by post-earnings reactions. So, for this scenario to play out, the market needs to switch its opinion on these fallen angels.
If you are bearish, you will quickly note that we observed a similar divergence in April. At that time, the S&P 500 hit a fresh 19-month high on the heels of a low-volume, 2-month buying spree. T2108 began slipping at the beginning of the month and first punctured the 70% threshold in dramatic fashion as the S&P 500 sold off 2.3% on very high volume. We have not yet seen a high-volume, big sell-off day in the S&P 500 (we came close on October 19). If (when?) we do, that day could finally signal an end to the current run.
T2108 has now flashed overbought for an incredible 37 trading days. There are only 6 other overbought periods since 1986 which lasted longer. The last two were 38 days ending April 26, 2010 and 51 days ending June 12, 2009. (We have to go back to 2003 to find another longer period). The last extended period ended very badly, and the market is still recovering. The second one created one of the bigger bearish headfakes we have seen in a long time.
While I am keeping both bearish and bullish implications in front of me, I recognize that these kinds of periods tend to produce a lot of complacency. I know I have gotten too complacent by not checking on this indicator as regularly as usual, and by persistently mining the fields for post-earnings disasters to buy for a bounce. On the other hand, one big factor working against complacency this time around is the amount of angst that is now interwoven with excited anticipation of next week’s events. For example, there have been numerous and loud warnings about selling on next week’s news even as others assume that this country will come out of the mid-term elections with a renewed ability to cope with its deep economic problems. I believe the elections will only determine the degree of crippling gridlock the government will suffer (meaning that the two major parties will be no better able or prepared to cooperate) and that another round of quantitative easing can only be most successful at generating undesirable levels of inflation.
Absorbing the implications of the current pattern in T2108 has re-awakened my extreme caution.
(See “Using the Percentage of Stocks Trading Above Their 40DMAs (T2108) to Identify Overbought Conditions on the S&P 500” for my last complete analysis of the historical record on T2108 during overbought conditions.)
Be careful out there!
Full disclosure: long SSO put
