I tried to make the case on Monday that the shrill commentary about the struggling American economy and its tepid stock market were getting overwrought with the kind of fever only a contrarian could love. It turns out there were other sentiment indicators flashing important extremes:
“Bullish Sentiment Plummets to Credit Crisis Low“ (CNBC, August 26)
“The number of individual investors who have a bullish outlook on the stock market for the next six months plunged to 21 percent, from 30 percent last week…this is the lowest weekly reading from the American Association of Individual Investors since a March 2009 level of 19 percent, which occurred just before the S&P 500 collapsed to a 12-year low of 676.”
“Institutional and retail investors alike are skeptical“ (Schaeffers Research, August 28)
“If it isn’t enough that the economic and political backdrop are scaring the living daylights out of retail and institutional investors, a multitude of chart patterns (“death cross,” bearish “head and shoulders,” “Hindenburg Omen”) have added to…the long list of concerns…” (The Hindenberg Omen was said to have made its way onto talk radio shows that never discuss the financial markets and onto other mainstream media).
“From a shorter-term perspective, there is a tremendous amount of put open interest just below current levels on major exchange-traded funds that we follow.”
“Corporate insiders are betting this is just a correction“ (Marketwatch.com, August 31)
“…insiders’ [buying] behavior at the end of August was more bullish than at any time since late March and early April of 2009, when the bull market was just three weeks old.”
Sure enough, over the course of the week, the apparently high odds of Armageddon quickly gave way to a counter-mood rally.
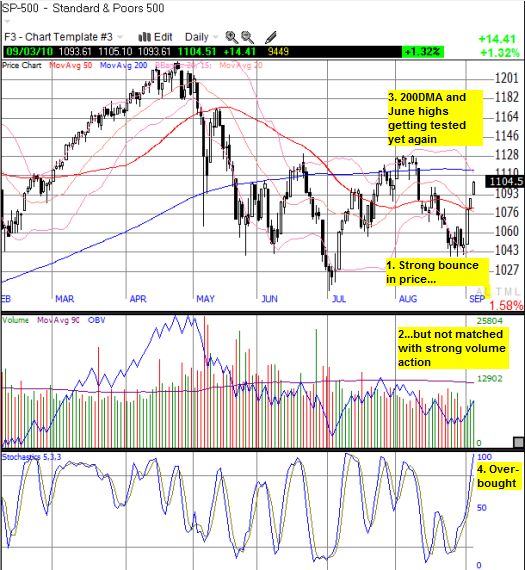
In a near-repeat of the bounce from the stressful July lows, the S&P 500 rocketed almost 3% on Wednesday and added to its gains with the close of the pre-Labor Day week of trading. Unlike July, the market spent six trading days unable to break important resistance at 1040 on the S&P 500 (thanks to all those puts?) before the churn finally resolved to the upside. Of course volume was as low as ever, but the current trading range escaped alive. The index has set up to challenge its June highs once again. It may be useful to note the large bullish divergence created by the extreme lows in sentiment reminiscent of the March, 2009 lows, and the stock market which is nowhere near those levels. In other words, the stock market is not likely to break its July lows any time soon without some fresh, new catalyst.

Before we do a 180-degree flip, the above chart demonstrates that the swift rally has landed the S&P 500 right under strong resistance levels without buying power backing the price action. Stochastics are also essentially at over-bought levels. Moreover, T2108, the percentage of stocks trading above their respective 40DMAs, has shot right over the 70% threshold that defines over-bought trading conditions.
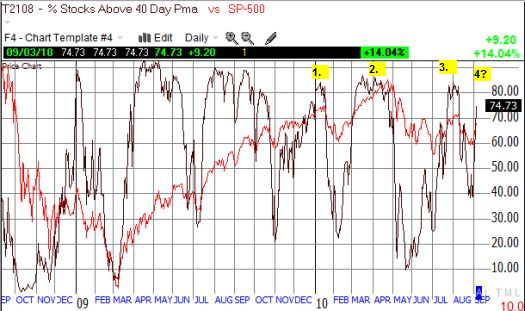
This time, I overlay the S&P500 with T2108 to demonstrate how things have changed since I did my last detailed examination of how the market trades with the T2108 flashing over-bought signals. The numbers label over-bought signals that worked, all in 2010 – a stark contrast to their consistent failure in 2009 to signal any significant sell-offs.

*All charts created using TeleChart:

During the rally off the March, 2009 lows, T2108 over-bought levels mattered little as the market remained in a strong upward trend. In a VERY rare move, T2108 even eased over 90% in April, 2009 without triggering a strong correction. It was not until the low-volume, post-Christmas rally that T2108’s signal finally worked as expected. The signal worked two more times this year. Note well that all three successes only triggered after T2108 traded above 80%, not 70%. Given deep negativity is still smoldering, I suspect T2108 will again hit 80% before the market corrects – perhaps after a marginal break above the June resistance.
Until T2108 makes it into the mainstream media…be careful out there!
Full disclosure: long SSO puts

Like your T208 oscillator. Actually Your indicator should work from oversold level in 2009 till april 2010. Since April your oscillator is quite effective on the overbought and oversold side. But much more effective on the overbought side.
What I see from your indicator is that instead of contrarian tool ..it is indeed a major trend tool. What that indicator is showing right now is that the major trend has thus changed to the downside. We are having the normal consolidadtion for a move to possibly to the downside.
I like your interpretation and will be looking for more confirmation of this twist. If you don’t mind, I will likely build on this idea next time I talk about T2108.