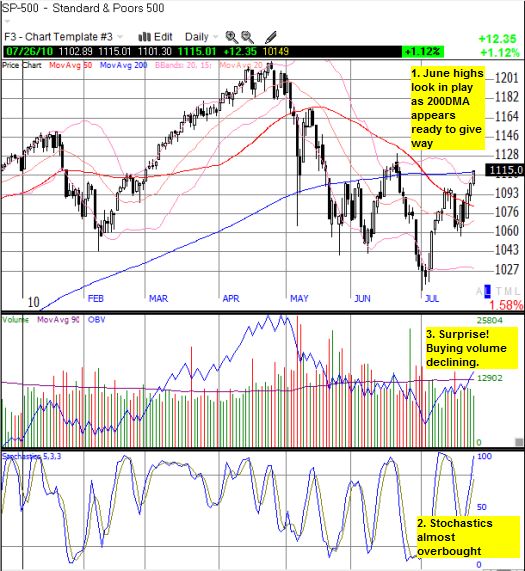
Momentum continues to swing swiftly in favor of the bulls. The stock market is now pushing deep into overbought territory just three weeks after it was fashionable again to talk about a double dip recession. Last week, the S&P 500 broke a downtrend I assumed would hold for at least a few more weeks. It is now pushing right up against its 200-day moving average (DMA). The June highs are within the line of fire. There are all events I barely considered possible as late as two weeks ago, especially this soon. I am NOT surprised that buying volume has dried up as the rally extends. Sellers are stepping aside as good earnings news trumps the poor macro-economic news that has escorted the market downward since the April highs burst into the flames of “sell in May.”

These are moments of anticipation and building excitement for the bulls, but this is exactly where the market looks the least attractive from the long side, especially for shorter-term (swing) trades.
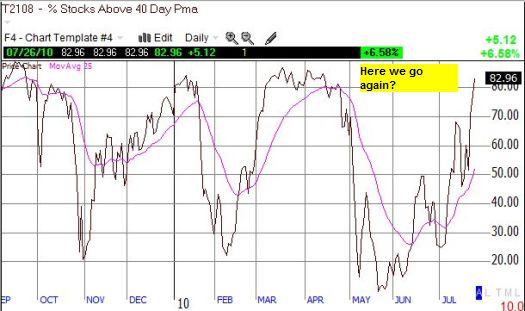
T2108, the percentage of stocks trading above their respective 40DMAs (and one of my favorite technicals), has happily stepped into a technical picture that has tried feverishly to shake its bearish charm. At 83%, T2108 is well above the 70% threshold that typically signals overbought conditions. These levels were last seen at the April highs.

With buying getting ever more anemic, it is tempting to ramp up shorts here. I think waiting for a breach of a previous day’s lows creates a better risk/reward. The S&P 500 has moved straight up in a near-repeat of the bounce from 2010’s fresh lows. Whenever this stretch ends, it should open up plenty of attractive shorting opportunities.
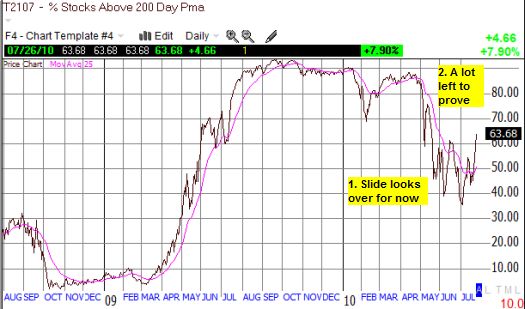
The most interesting change in character is in T2107, the percentage of stocks trading above their respective 200DMAs. This indicator has gone from an ominous downtrend, to a fresh two-month high. This might bode well for future dip-buying for those inclined to remain bullish.

*All charts created using TeleChart:

Be careful out there!
Full disclosure: long SSO puts
