With tongue reaching for the cheek last week, I declared the market both extremely undervalued and very overvalued, guessing that “as earnings season grinds on, I suspect the near-predictable pattern of post-earnings fades will finally wear thin, giving way to more bullish behavior.” I did not expect the turn to happen so clearly and dramatically within a day or two.
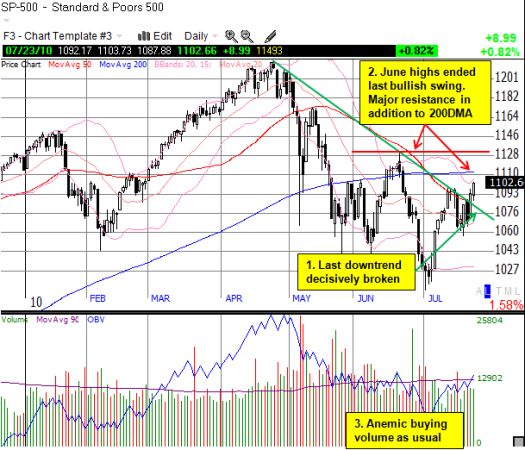
The 3-month violent seesaw between bears and bulls took a very favorable swing for the bulls this past week. For seven straight days, the S&P-500 failed to crack resistance at the 50-day moving average (DMA). The index finally broke through on Thursday. On Friday, it actually printed follow-through strong enough to set new highs for July. The last downtrend has now ended. Two key lines of resistance remain overhead. If the market conquers these, the July low will quickly become a distant memory, a milestone to revisit another day further in the future. My vote goes with the October earnings season. The November elections are too much a potential game-changer for me to even dare hazard a guess for market direction: a Democratic survival would no doubt send Republicans into a steep and sustained depression, weighing the market down in the process; the stock market could rally long and strong in anticipation of or in the aftermath of a Republican victory. Regardless of the outcome of these elections, the reality that BOTH of our major parties are sources of major problems will smack us in the face soon enough in 2011 and onward.
But I digress…back to the charts:

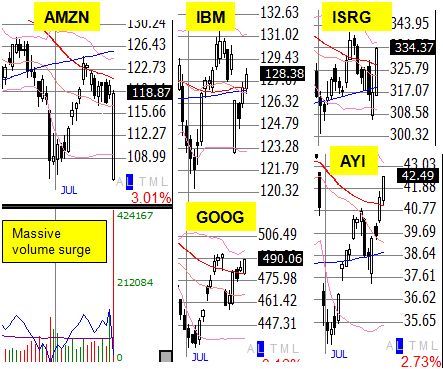
The reaction to earnings announcements has indeed begun to change. Earnings fades to the downside have given way to some impressive fades to the upside:
- Amazon (AMZN) had the most amazing one-day comeback yet for this season – it was down as much as 15% in the after-hours Thursday night following earnings. It opened 12% down and by the close it ended just 1% down. I suspect if the market had another hour of trading, AMZN would have closed flat.
- IBM had a similar, but smaller, one-day bounce after gapping down in response to earnings on Tuesday. On Friday, IBM recaptured all its post-earnings losses.
- Even Google (GOOG), just about the worst performing big-cap tech stock of 2010, recaptured all its post-earnings losses with Friday’s close.
- Intuitive Surgical (ISRG) traded almost 7% down in after-hours Wednesday in response to earnings. ISRG quickly recovered all its losses right after the open. It closed back below its 200DMA but on Friday it rallied well above the 50DMA and 200DMA. It is now UP 6% since its pre-earnings close.
- Finally, remember Acuity Brands (AYI)? It dropped 11% on June 30th in response to earnings. After bottoming on July 2, it finally recovered all its losses on July 15th. It stumbled for 2 more days and is now about 5% UP from its pre-earnings close.
There are many more examples I could post. I cannot post all the charts I would like. Instead, I have posted below snippets of the above action. In other words, the bulls are retaking the momentum and buyers are shopping for “bargains.” Yesterday, I noted how industrial stocks are starting to turn the corner with MMM looking particularly bullish. (Quick sidenote – given these impressive moves, I am quite surprised that INTC has yet to recover all its post-earnings GAINS. This could be telling…)

Now, of course, there is a “but” to this apparent shift in momentum. In fact, I have three:
- The June high marked the end of the last apparent shift back in favor of the bulls. It is a KEY line of resistance. (See chart above)
- The percentage of stocks trading above their 50DMAs, T2108, has swung back to overbought territory for the first time since the April highs. T2108 hit the 70% threshold on Thursday and is now at a lofty 78%.
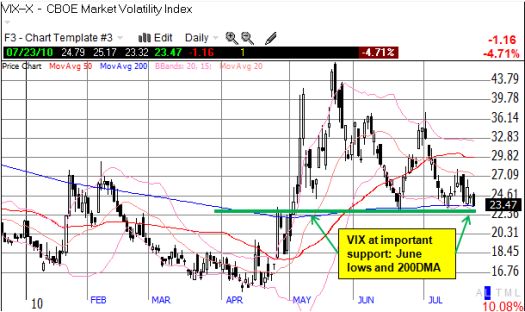
- The volatility index, VIX, is at 2-month lows and a major support line. (Chart below)

*All charts created using TeleChart:

It is much easier to use T2108 as a single trading indicator when it hits oversold levels. Overbought conditions can last much longer than oversold conditions (I last looked at this in early 2009). The trading rule is to avoid fresh longs, lighten up on existing ones, and look for confirmation on shorting opportunities. This is a strong recipe for taking things one day at a time and evaluating opportunities on a case-by-case basis. I am inclined to consider volatility cheap here, so overall I favor buying puts (the VIX held support two weeks ago, but I am guessing it will crack this time, albeit temporarily). To this end, I am sticking to my puts on indices. I am not yet freshly loading up on puts on individual stocks. Instead, I am now trading earnings reactions with a bullish bias (with some selective exceptions) and keeping holding periods extremely short.
Be careful out there!
Full disclosure: long puts on SSO and XLI; long GOOG; short AMZN and long put spread on AMZN; long VXX
