Earnings excitement is one casualty of the current selling in the market. Several big cap stocks and multinational companies generated a lot of hype and attention from their earnings results this quarter. A number of those gains have been erased and then some. Four stocks have attracted my particular interest:
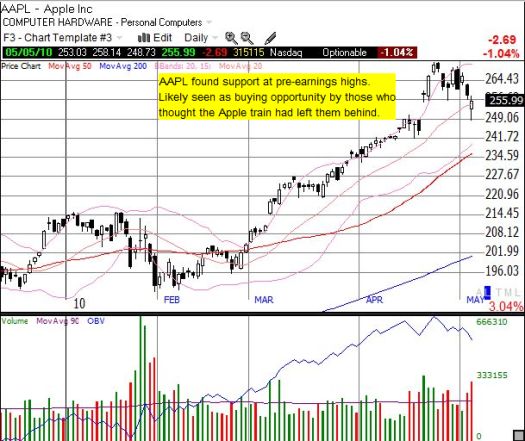
- Apple (APPL) – A market darling that is a must own amongst institutional buyers.
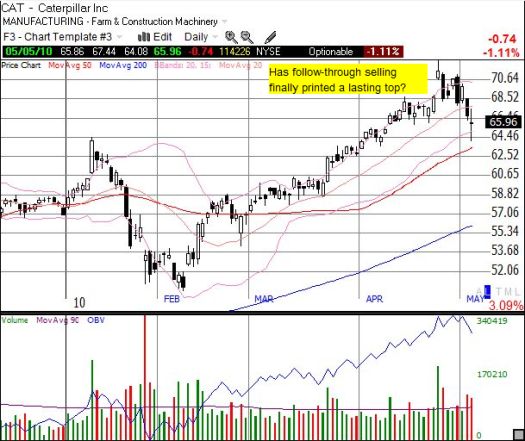
- Caterpillar (CAT) – I always watch it as an indicator of strength in cyclicals and the “China story.”
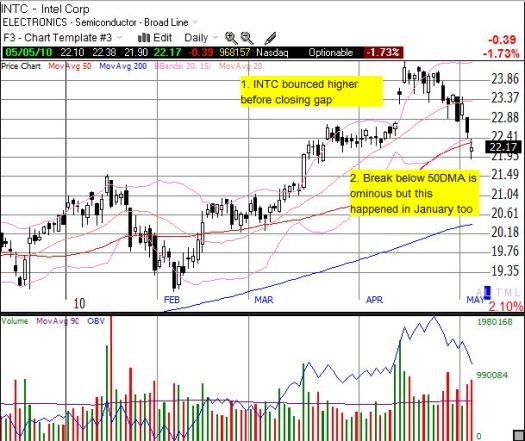
- Intel (INTC) – Despite my expectations for peak margins, INTC has been able to manage earnings expectations and produce welcome results.
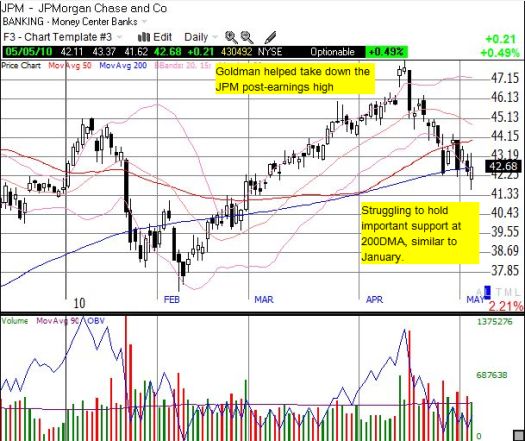
- JPMorgan (JPM) – This bank is today’s best indicator of health in the financials (as opposed to just an indicator of willingness to speculate in financials).
I have posted charts of these stocks from yesterday below. The current tops in these four stocks are dramatic, but only CAT looks like a convincing climactic top given the fade from the top on the day earnings were reported and the strong follow-through the next day (CAT printed a climactic top pattern in January as well but it was nullified in April). Note that AAPL continued higher for a few days after its earnings, INTC churned before turning lower, and JPM sold off dramatically upon announcement of fraud charges against Goldman Sachs (GS). (Honorable mention goes to First Solar [FSLR] which today erased all of its post-earnings gains – click here for my review of their earnings. I started scaling back into the stock today as it retested its 200DMA)
While earnings excitement fades, trends are also breaking. The percentage of stocks trading above their 200-day moving averages (DMAs) (T2107) has tumbled for the first time since the January-February correction. It was at 76% yesterday and at the time of writing it has dropped below 73% (see chart below). If it breaks the closing low of 69% from February, watch for selling pressure in the market to increase.

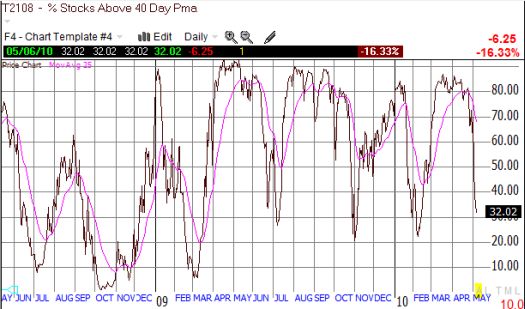
Finally, the percentage of stocks trading above their 40DMAs (T2108) has dropped fast. Yesterday, it closed at 38%. At the time of writing, it is now at 32%. The market is not considered short-term oversold until this indicator hits 20% or lower. At current rates of descent, T2107 will test its support just as T2108 finally hits the oversold level. If this happens, I will be looking for a further spike in the VIX (volatility index) as a powerful buying signal. However, a lower low for T2108 will send up a big red flag for the sustainability of the overall rally in the market. (Click here for my last review of the relationship between the VIX and T2108).
*All charts created using TeleChart:

Be careful out there!
Full disclosure: long GS shares, long GS put spread, long FSLR
