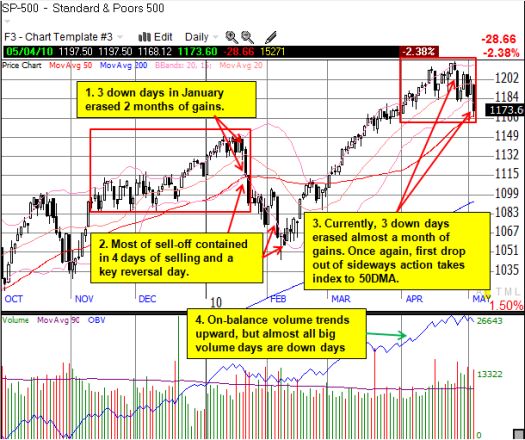
The financial markets finally got a bailout package for Greece – and they vigorously sold off on the news. (Yes, there are plenty of other negatives out there as well…all ignored until now). The good news is that the S&P 500 remains higher than it was back in January when the stock market last cared about European sovereign debt issues. The bad news, perhaps, is that the developing pattern looks similar to the correction in January and February. The chart below shows that Tuesday’s sell-off finally shook the S&P 500 from its wide, sideways action over the past few weeks and dropped the index directly to the 50-day moving average (DMA). Similar action occurred in January on the way to a sell-off that lasted two more weeks.
While the sell-off in January and February lasted a total of 3 weeks, most of the selling occurred in four days of trading action plus a key reversal day. But that was enough to wipe out a little over two months of gains. Given the backdrop is once again dominated by the debt of Europe’s governments, perhaps we get a repeat of January’s action. If so, May will be a stomach-churning month that ends up erasing all of March’s gains at some point. Such a wipe-out would make sense given the amount of giddy complacency that powered much of the move from March to April.

*Chart created using TeleChart:

For additional reference, the percentage of stocks trading above their 40DMA is now at 50%. This index is typically considered oversold at 20%. Finally, key big cap, multi-national stocks like INTC and CAT have closed their post-earnings gaps and are moving even lower (I hope to post some charts on these soon).
Be careful out there!
Full disclosure: no positions
