
The last Housing Market Review covered data released in February, 2016. At the time, sentiment and data ahead of the Spring selling season was not as strong as I had anticipated. The iShares US Home Construction ETF (ITB) has gained little since then and has even stalled out at resistance at its 200-day moving average (DMA). Under the circumstances, combined with an overbought market, I decided to take profits in a little over half of my holdings in individual home builders. On a seasonal basis, taking some profits off the table also makes sense (see below).
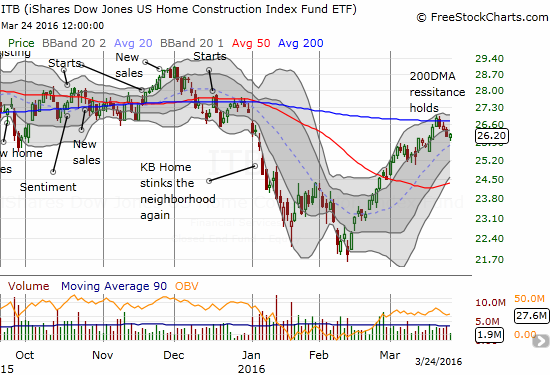
Source: FreeStockCharts.com
New Residential Construction (Housing Starts) – February, 2016
Housing starts were blistering in February. The pace continues to surprise me given these are homes that will likely be for sale well after the Spring selling season. The pace of starts also still seems a bit out of sync with the sentiment of home builders.
Privately owned housing starts for 1-unit structures came in at 822,000 for February. The January 1-unit starts were revised upward to 767,000 from 731,000. So, the month-over-month change was 7.2% which created an incredible 37.0% year-over-year surge in starts. The chart below shows the blistering pace of housing starts, a pace that has picked up in recent months.
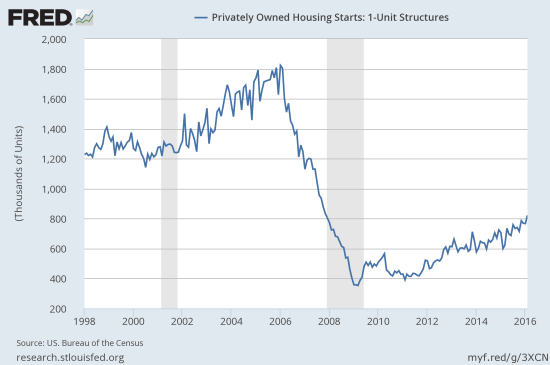
Source: US. Bureau of the Census, Privately Owned Housing Starts: 1-Unit Structures [HOUST1F], retrieved from FRED, Federal Reserve Bank of St. Louis, March 26, 2016.
The South led the regions in January but lagged in last place for February with “only” a 19.5% year-over-year gain. The Northeast led the pack with a 154.5% year-over-year gain. The Midwest surged 88.9% and the West came in third at 32.4%.
The overall trend and momentum for housing starts continue to impress me.
New Residential Sales – February, 2016
New single-family home sales came in weak again at 512,000. The 6.1% year-over-year drop was greater than January’s year-over-year decline. The 2.0% monthly gain provided a small reminder that 2015 started with a tremendous surge in new home sales which makes for difficult comparisons. This latest data point tells me even more strongly than last month that a monthly range is likely developing for sales. Given the increasing pace of housing starts, this sales rate will need to break out of this range to the upside in coming months.
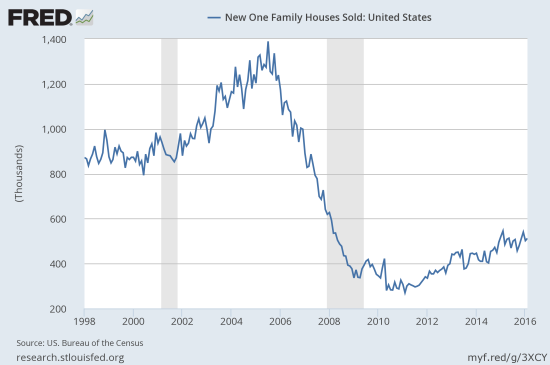
Source: US. Bureau of the Census, New One Family Houses Sold: United States [HSN1F], retrieved from FRED, Federal Reserve Bank of St. Louis, March 26, 2016.
New home inventory fell slightly from 5.8 months to 5.6. This is closely in-line with the six months typically considered balanced. The boost in availability in January did not drive the higher sales pace I had expected.
The regions were very mixed in performance. The Northeast cooled off from last month’s 100% year-over-year gain to a 3.8% drop in February. The Northeast’s extreme volatility continues. The Midwest and the West were the two regions with gains over last year’s February: 1.9% and 10.2% respectively. The West bounced back sharply from January’s monthly 24.1% year-over-year drop. The South had the largest yearly loss at -14.3%. This poor performance puts me on full alert for Texas.
Existing Home Sales – February, 2016
Whereas existing home sales performed a lot better than new home sales in January, this time, existing home sales were weak alongside new home sales. You know the data must be disappointing when the National Association of Realtors (NAR) uses a title like “Existing-Home Sales Fizzle in February.” The NAR reported…
“The lull in contract signings in January from the large East Coast blizzard, along with the slump in the stock market, may have played a role in February’s lack of closings. However, the main issue continues to be a supply and affordability problem. Finding the right property at an affordable price is burdening many potential buyers…
The overall demand for buying is still solid entering the busy spring season, but home prices and rents outpacing wages and anxiety about the health of the economy are holding back a segment of would-be buyers…”
I am wondering whether it is also possible that a lot of demand was pulled forward into January for some reason. January’s existing sales were last that high six months prior. On a year-over-year basis, February’s existing home sales still increased 2.2%, but they dropped 7.1% from January. This is not the kind of momentum expected or desired going into the Spring selling season. However, if there was some kind of pull-forward effect in January, then February should look like a blip as the season pushes into March and April. We will see soon.
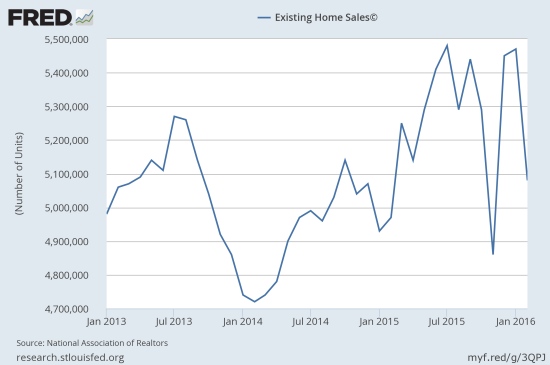
Source: National Association of Realtors, Existing Home Sales© [EXHOSLUSM495S], retrieved from FRED, Federal Reserve Bank of St. Louis, March 6, 2016.
(At the time of retrieval, for some reason, data were only available back to 2013).
Although housing inventory increased 3.3% from the prior month, inventory is still down 1.1% from a year-ago. Months of inventory increased from 4.0 months to 4.4 months, still far short of the 6 months typically indicative of a balanced market. Recall that December’s inventory of 3.9 months was the lowest since 3.6 months of supply in January, 2005. Despite ever increasing prices, the supply side of the market is still not responding. However, this lack of response helps to explain the ability of home builders to steadily increase housing starts as shown above. February’s 4.4% year-over-year increase in the median price of an existing home represents the 48th consecutive month of year-over-year increases.
Interestingly, individual investors bought 18% of existing homes in February, surpassing January’s 17% share and well above a trough of 12% in August, 2015. The participation rate of these investors is back to levels last seen in April, 2014 and defies recent fears of a retreat of investors from the housing market that could also signal a top.
On the other hand, first-time homebuyers are still stuck in neutral. Their share of purchases fell from 32% in January to 30% in February. This participation rate is still up from the 29% seen in February, 2015.
Video also available directly from YouTube.
Home Builder Confidence: The Housing Market Index– March, 2016
After a worrisome February, the Housing Market Index (HMI) stabilized at 58 for March. In the last Housing Market Review, I cited a rare and troubling divergence between current and future sales conditions. In February, current conditions, finally responded with a three point dip from 68 to 65. For March’s reading, the overall stabilization hides a continued drop in sales expectations for the 6 months while expectations for traffic increased enough to compensate. I am more concerned with the on-going drop in sales expectations than the apparent stabilization of prospective traffic. I will be very eager to see how these components respond through the Spring selling season.
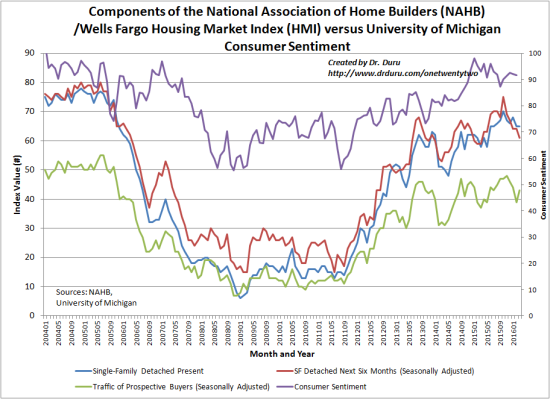
Source: The National Association of Home Builders (NAHB)
(The March reading for Consumer Confidence was not ready at the time of writing)
In February, the three-month moving averages for regional HMI scores declined in all four regions of the country. This month the numbers were more mixed: “…the Midwest posted a one-point gain to 58 while the South was unchanged at 59. The West registered a three-point decline to 69 while the Northeast fell one point to 46.”
Parting thoughts
I earlier thought the strong housing numbers of 2015 augured well for the Spring selling season. First, the HMI tempered my expectations. Next, it was new home sales. Now, it is existing home sales. The momentum has clearly slowed for the housing market. Normally, I would then look at the steady increase in housing starts as a cause for outright alarm. Yet, overall housing inventories are low and median home prices keep marching ever upward. So, overall, the prospect for increased housing supply is a good thing for now.
With the Spring selling season getting started, the seasonal trade on home builders has essentially come to an end. That reality combined with all this slowing momentum motivated me to close out a few more of my trades on home builders. I am exercising an abundance of caution while still looking out for the next opportunity to buy on dips.
The charts below show that the seasonal trade on home builders is performing at its worst since 2009 on an absolute and relative basis (compared to the S&P 500 (SPY)).
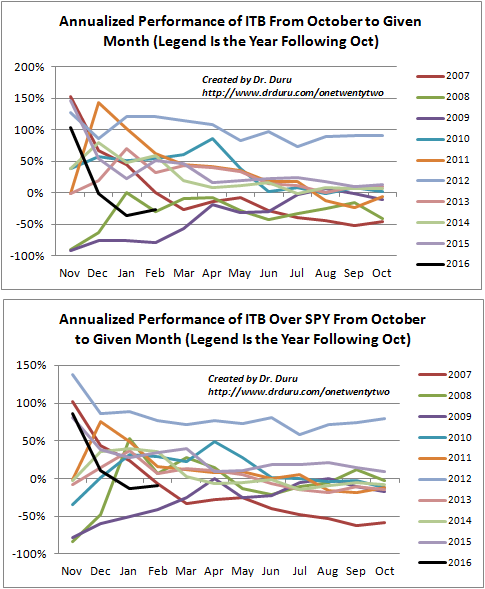
Source for price data: Yahoo Finance
At least KB Home (KBH) managed to report earnings that did not tank the sector. Indeed, KBH is on the edge of a major breakout. I was prepared to exit during the time I wrote my last Housing Market Review. I decided to sell my call options ahead of earnings.
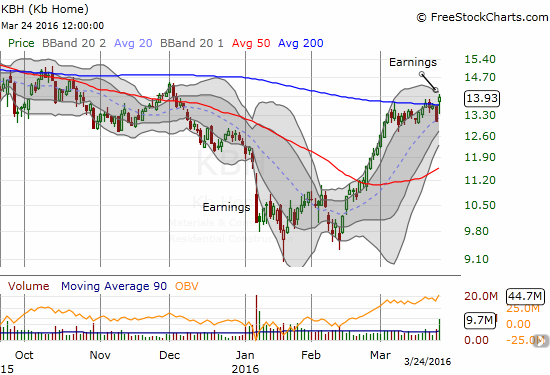
Source: FreeStockCharts.com
Be careful out there!
Full disclosure: long ITB call options