
(T2108 measures the percentage of stocks trading above their respective 40-day moving averages [DMAs]. It helps to identify extremes in market sentiment that are likely to reverse. To learn more about it, see my T2108 Resource Page. You can follow real-time T2108 commentary on twitter using the #T2108 hashtag. T2108-related trades and other trades are occasionally posted on twitter using the #120trade hashtag. T2107 measures the percentage of stocks trading above their respective 200DMAs)
T2108 Status: 31.0%
T2107 Status: 16.6%
VIX Status: 24.1
General (Short-term) Trading Call: bullish
Active T2108 periods: Day #2 over 20%, Day #1 over 30% (ends 6 days under 30% – corrected earlier data) (overperiod), Day #46 under 40%, Day #50 below 50%, Day #65 under 60%, Day #406 under 70%
Commentary
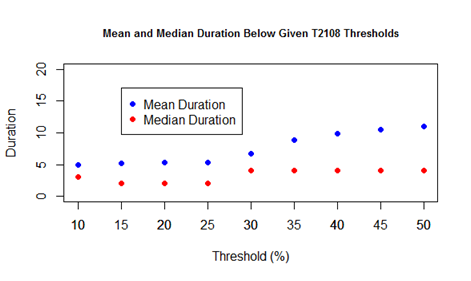
Market sentiment made another step in the right direction today. With T2108 closing at 31.0%, the market printed strong follow-through to Friday’s impressive bounce from oversold conditions. T2108 ended 6 days trading below 30%. This duration is around the mean amount of time for a trip below 30%. However, the chart below shows that the 46 days below 40% is an extremely long time. This is still a market under pressure.
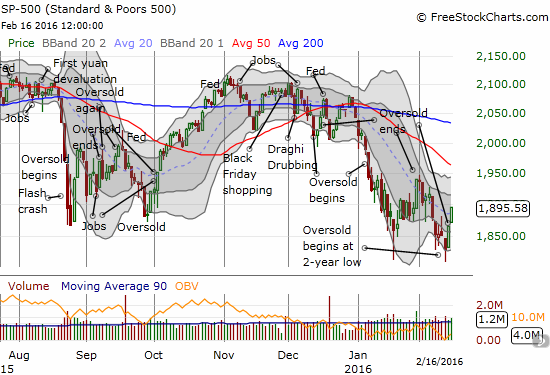
The S&P 500 (SPY) gained a healthy 1.7% on the day. This is the second day in a row of gains. As the chart below shows, the index has not been able to string THREE days in a row of gains since the last gasps of the Santa Claus rally in late December. Yet one more way to appreciate the kind of selling pressure that has dominated the action in 2016.
Tuesday’s move confirms once again overhead resistance for the VIX, but the trend remains up thanks to both the 20 and 50DMAs.
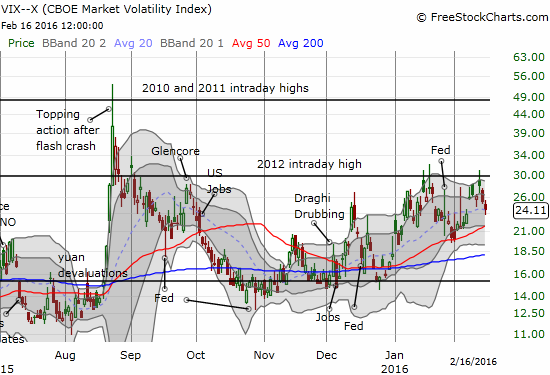
Given the uptrend and the heavy selling pressure for almost two months, I am VERY surprised that the VIX has remained relatively well-contained. That selling pressure included THREE oversold periods, one of which took T2108 all the way to low single digits just last month. Something does not “add up” here. Either there is some kind of bullish divergence occurring between the relatively tame VIX and the long-suffering S&P 500 or there is some kind of pressure building for a future volatility surge. Traders certainly cannot get comfortable under these circumstances.
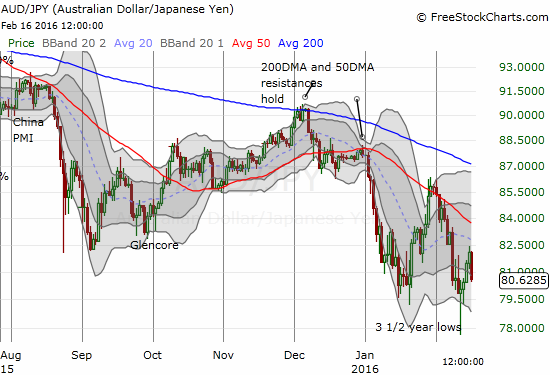
If the Australian dollar versus the Japanese yen (AUD/JPY) maintains the current overnight sell-off at the time of writing, the S&P 500 is looking at ending another winning streak at two days.
I used the day’s rally to pick some last hedges against bullishness. I am now going to sit tight from here and see what happens.
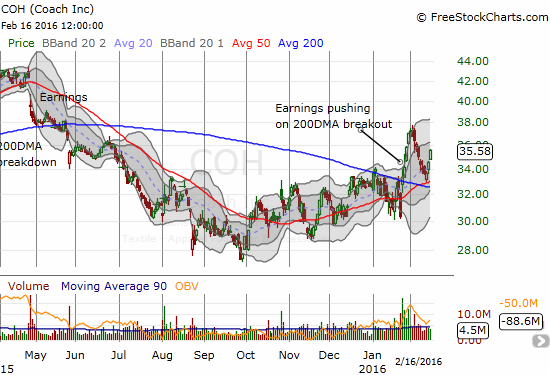
One of my more intriguing longs is probably Coach (COH). I missed the neat bounce off 50DMA support on Friday, but I jumped in right at the open.
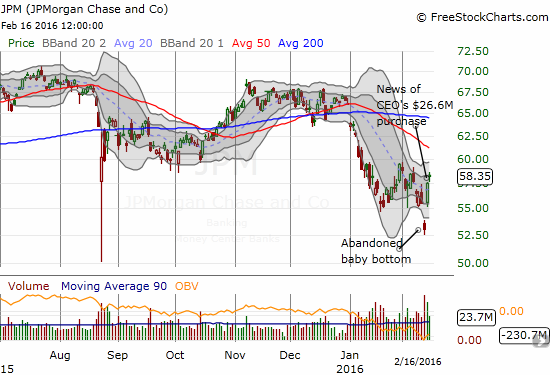
Given JP Morgan Chase (JPM) helped to mark the latest bottom, I am now watching the stock closely. As I suspected in the last T2108 Update, Friday’s gap up that created a bullish abandoned baby bottom likely drained a lot of energy from buyers for now. JPM still faces stiff resistance at recent highs and then the 50DMA after that.
Finally, in the last T2108 Update I promised something on gold and silver. I got gold covered here: “Market Sentiment Marks A Fresh Bottom For Gold.” One of the comments on that piece made me look into the gold/oil ratio. One word: WOW. An all-time high! Something has to give…
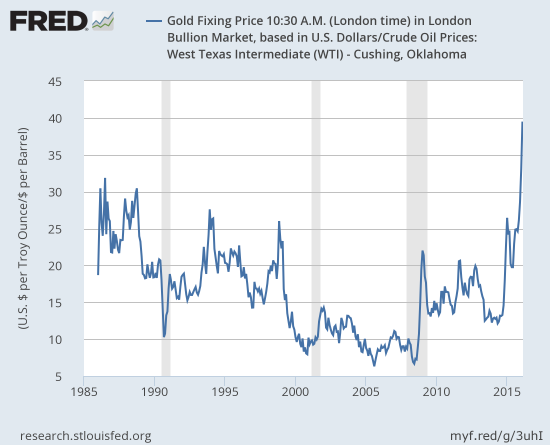
Source: Ice Benchmark Administration, Gold Fixing Price 10:30 A.M. (London time) in London Bullion Market, based in U.S. Dollars [GOLDAMGBD228NLBM], retrieved from FRED, Federal Reserve Bank of St. Louis, February 17, 2016.
US. Energy Information Administration, Crude Oil Prices: West Texas Intermediate (WTI) – Cushing, Oklahoma [DCOILWTICO], retrieved from FRED, Federal Reserve Bank of St. Louis, February 17, 2016.
— – —
For readers interested in reviewing my trading rules for T2108, please see my post in the wake of the August Angst, “How To Profit From An EPIC Oversold Period“, and/or review my T2108 Resource Page.
Reference Charts (click for view of last 6 months from Stockcharts.com):
S&P 500 or SPY
U.S. Dollar Index (U.S. dollar)
EEM (iShares MSCI Emerging Markets)
VIX (volatility index)
VXX (iPath S&P 500 VIX Short-Term Futures ETN)
EWG (iShares MSCI Germany Index Fund)
CAT (Caterpillar).
IBB (iShares Nasdaq Biotechnology).
Daily T2108 vs the S&P 500
")
Black line: T2108 (measured on the right); Green line: S&P 500 (for comparative purposes)
Red line: T2108 Overbought (70%); Blue line: T2108 Oversold (20%)
Weekly T2108

*All charts created using freestockcharts.com unless otherwise stated
The charts above are the my LATEST updates independent of the date of this given T2108 post. For my latest T2108 post click here.
Related links:
The T2108 Resource Page
Expanded daily chart of T2108 versus the S&P 500
Expanded weekly chart of T2108
Be careful out there!
Full disclosure: long SSO call options, long SSO shares, long SVXY shares, long UVXY puts, short AUD/JPY, long GLD, long COH call options, short USO calls and put options, long USO call options