
(T2108 measures the percentage of stocks trading above their respective 40-day moving averages [DMAs]. It helps to identify extremes in market sentiment that are likely to reverse. To learn more about it, see my T2108 Resource Page. You can follow real-time T2108 commentary on twitter using the #T2108 hashtag. T2108-related trades and other trades are occasionally posted on twitter using the #120trade hashtag. T2107 measures the percentage of stocks trading above their respective 200DMAs)
T2108 Status: 39.8%
T2107 Status: 31.1%
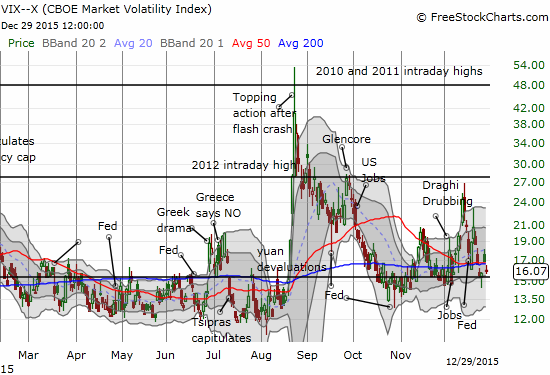
VIX Status: 16.1
General (Short-term) Trading Call: bullish – see below for caveats
Active T2108 periods: Day #10 over 20%, Day #4 over 30% (overperiod), Day #14 under 40% (underperiod), Day #18 below 50%, Day #33 under 60%, Day #374 under 70%
Reference Charts (click for view of last 6 months from Stockcharts.com):
S&P 500 or SPY
SDS (ProShares UltraShort S&P500)
U.S. Dollar Index (volatility index)
EEM (iShares MSCI Emerging Markets)
VIX (volatility index)
VXX (iPath S&P 500 VIX Short-Term Futures ETN)
EWG (iShares MSCI Germany Index Fund)
CAT (Caterpillar).
IBB (iShares Nasdaq Biotechnology).
Commentary
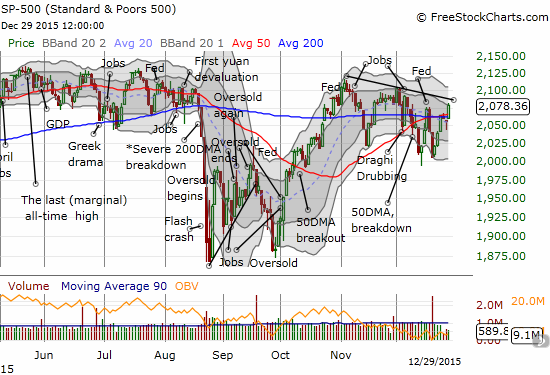
The S&P 500 (SPY) is flat for December. The index is up a mere 0.9% year-to-date – close to contradicting the “January barometer” once again. The Santa Claus rally is a clear winner with a 3.2% gain so far. Most importantly, the S&P 500 once again closed above its 50 and 200-day moving averages (DMAs). The index is even (marginally) at a post-Fed high. Only a short-term downtrend divides the index between yet more churn and a potentially important breakout.
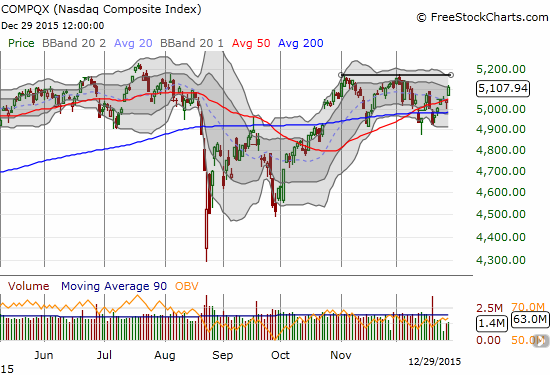
The NASDAQ (QQQ) experienced a cleaner breakout above 50DMA resistance but it also now faces critical resistance looming overhead from a short-term trendline connecting the last two peaks.
T2108, the percentage of stocks trading above their respective 40DMAs, closed strong at 39.8%. This level is a three-week high. T2108 confirms the bullishness of the S&P 500 which also closed at a 3-week high. T2107, the percentage of stocks trading above their respective 200DMAs, is even adding its weight to the general bullishness. At 31.1%, T2107 is also at a 3-week high.
The volatility index, the VIX, is a lingering holdout. It is hovering above the critical 15.35 pivot. This pivot has served as general support for over two months now.
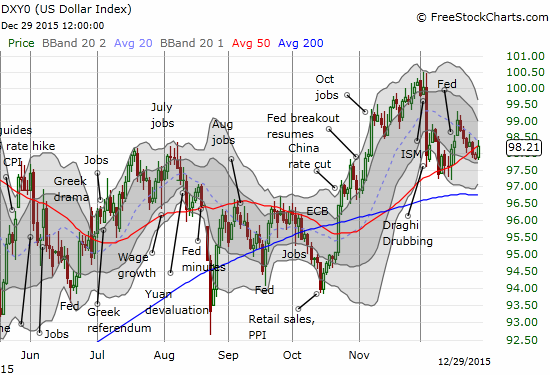
Finally, the U.S. dollar index is trading around and below its pre-Fed level. This lackluster support for the dollar suggests a lack of excitement for the potential of extended policy divergence going into 2016. Conventional wisdom says that a “calm” dollar is good for the stock market. I think the calm may at least benefit sentiment and those who chase “risk on” trades. However, I am looking to buy future dips in the dollar.
So as 2015 comes to a close, the stock market is delivering a convergence of indicators pointing to a breakout start to 2016. T2108 certainly has some room to run toward overbought levels (70%). For bullish confirmation, I am looking for the S&P 500 to print a strong close above the downtrend line pointed out above. I am still getting over my surprise that the index managed to close so strongly above combined resistance at the 50 and 200DMAs.
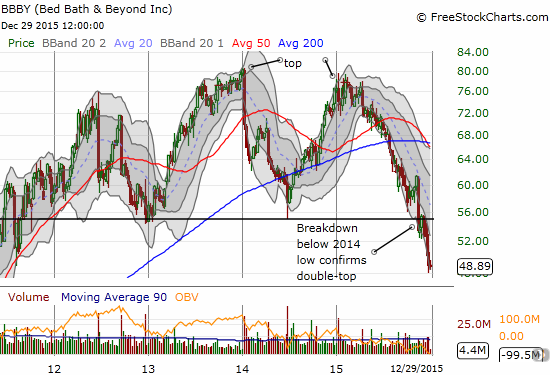
In the meantime, Bed Bath and Beyond (BBBY) recently caught my attention after it reduced guidance on December 23rd. I have been watching one retail stock after another crater since October. BBBY is one I should have had on my radar earlier. The stock made a “slow motion” double top over the first 3 1/2 months or so of 2015. A sell-off in November confirmed the double-top.
On the other hand, I HAVE checked-in periodically on fallen angel Wal-Mart Stores Inc. (WMT). It looks like value investors may FINALLY be nibbling on the stock.
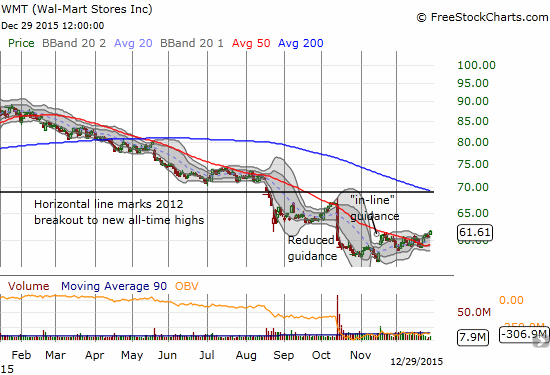
WMT’s bleeding appears to have ended. The stock gapped up when WMT delivered guidance in November and has managed to drift above 50DMA resistance since then. The stock even survived a gap fill on December 2nd. While a bottom is far from confirmed until WMT reverses the awful sell-off from October, it seems that it is time to “celebrate with the buyers” per the method I laid out for bottom-fishing. The stop on WMT would be a new 4-year low at $56 or lower. A more conservative stop-loss sits at $58 which would once again fill the November gap-up and break the most recent low.
Daily T2108 vs the S&P 500
")
Black line: T2108 (measured on the right); Green line: S&P 500 (for comparative purposes)
Red line: T2108 Overbought (70%); Blue line: T2108 Oversold (20%)
Weekly T2108

*All charts created using freestockcharts.com unless otherwise stated
The charts above are the my LATEST updates independent of the date of this given T2108 post. For my latest T2108 post click here.
Related links:
The T2108 Resource Page
Expanded daily chart of T2108 versus the S&P 500
Expanded weekly chart of T2108
Be careful out there!
Full disclosure: net long the U.S. dollar, long UVXY put options