
(T2108 measures the percentage of stocks trading above their respective 40-day moving averages [DMAs]. It helps to identify extremes in market sentiment that are likely to reverse. To learn more about it, see my T2108 Resource Page. You can follow real-time T2108 commentary on twitter using the #T2108 hashtag. T2108-related trades and other trades are occasionally posted on twitter using the #120trade hashtag. T2107 measures the percentage of stocks trading above their respective 200DMAs)
T2108 Status: 19.9% (Day #3 of oversold period that followed 11-day oversold period after one day).
T2107 Status: 22.3%
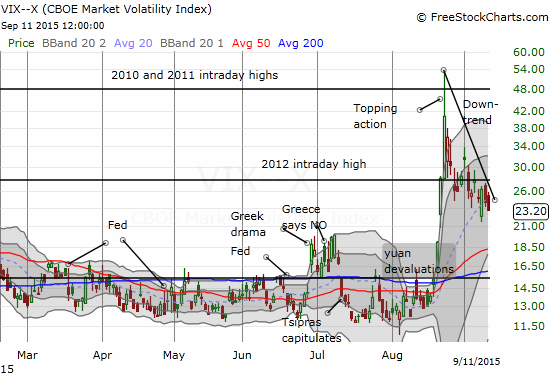
VIX Status: 23.2
General (Short-term) Trading Call: Bullish
Active T2108 periods: Day #3 under 20% (this oversold period followed 11-day oversold period after one day), Day #16 under 30%, Day #39 under 40%, Day #79 under 50%, Day #96 under 60%, Day #294 under 70%
Reference Charts (click for view of last 6 months from Stockcharts.com):
S&P 500 or SPY
SDS (ProShares UltraShort S&P500)
U.S. Dollar Index (volatility index)
EEM (iShares MSCI Emerging Markets)
VIX (volatility index)
VXX (iPath S&P 500 VIX Short-Term Futures ETN)
EWG (iShares MSCI Germany Index Fund)
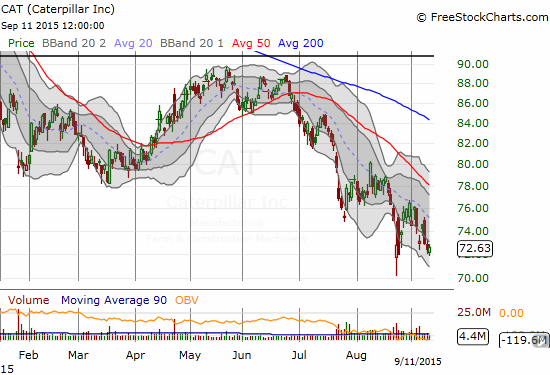
CAT (Caterpillar).
Commentary
Sometimes I have the feeling I am not the only one following T2108 when the market goes oversold. T2108 closed the week at 19.9% and just barely stayed oversold after going as high as 20.1%. The marginal gain on T2108 was matched by a marginal 0.45% gain on the S&P 500 (SPY).
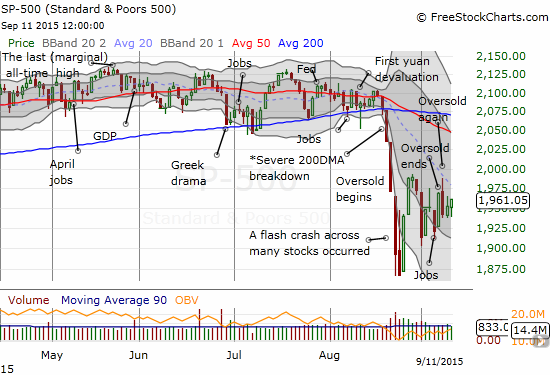
Note carefully that the S&P 500 has settled into a chopping pattern ever since the dramatic bottom from August. Under these conditions, T2108 could very well move in and out of oversold trading conditions without signalling any major change in market sentiment. The main target waving the red cape this coming week is Fedageddon: the moment the U.S. Federal Reserve delivers a much anticipated decision on monetary policy on September 17, 2015. It makes a lot of sense that buyers and sellers will remain locked into a stalemate until the Fed delivers a decisive moment.
Volatility is still sinking ahead of Fedageddon. I may not get a chance to do the pre-Fed fade of volatility at a steal of a price.
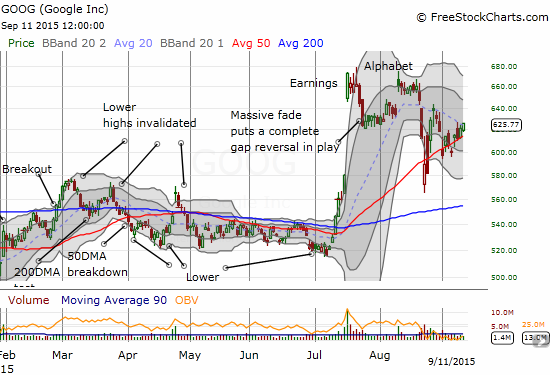
One of the more interesting charts of the key tells of the market remains Google (GOOG, GOOGL). The 50-day moving average (DMA) continues to provide post sell-off support. There is now a notable wedge formed by the 20DMA at the top and 50DMA at the bottom. I am on alert to follow the breakout (what I expect) or a breakdown.
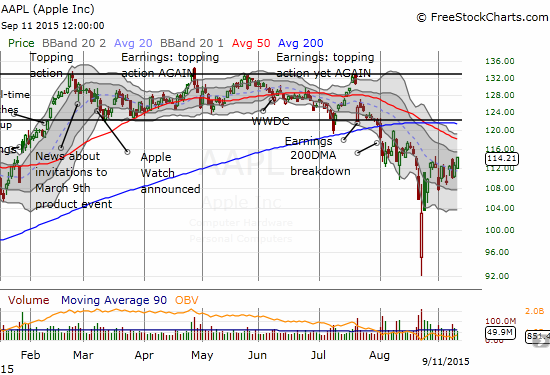
Also keep an eye on Apple (AAPL). This FORMER market leader is actually vying to regain its place as a market tell. AAPL is back to a positive 3.5% gain year-to-date. AAPL is breaking away from a 20DMA which has finally flattened out. A retest of the 50DMA resistance may be in the works soon. On September 9, AAPL made a product announcement that received the typical reactive sell-on-the-news. So, I find it even MORE intriguing that AAPL managed to end the week on a high note.
Finally, market tell Caterpillar (CAT) is still lagging. It is barely above its lowest close of the post sell-off period. Careful!
Daily T2108 vs the S&P 500
")
Black line: T2108 (measured on the right); Green line: S&P 500 (for comparative purposes)
Red line: T2108 Overbought (70%); Blue line: T2108 Oversold (20%)
Weekly T2108

*All charts created using freestockcharts.com unless otherwise stated
The charts above are the my LATEST updates independent of the date of this given T2108 post. For my latest T2108 post click here.
Related links:
The T2108 Resource Page
Expanded daily chart of T2108 versus the S&P 500
Expanded weekly chart of T2108
Be careful out there!
Full disclosure: long SVXY shares, long SSO shares and call options, long UVXY put options, long AAPL put spread, long CAT put options