
(T2108 measures the percentage of stocks trading above their respective 40-day moving averages [DMAs]. It helps to identify extremes in market sentiment that are likely to reverse. To learn more about it, see my T2108 Resource Page. You can follow real-time T2108 commentary on twitter using the #T2108 hashtag. T2108-related trades and other trades are occasionally posted on twitter using the #120trade hashtag. T2107 measures the percentage of stocks trading above their respective 200DMAs)
T2108 Status: 9.7% (a 59% increase and first after six straight days of declines)
T2107 Status: 19.4%
VIX Status: 30.3
General (Short-term) Trading Call: Bullish
Active T2108 periods: Day #4 below 20% (oversold), Day #5 under 30%, Day #28 under 40%, Day #68 under 50%, Day #85 under 60%, Day #284 under 70%
Reference Charts (click for view of last 6 months from Stockcharts.com):
S&P 500 or SPY
SDS (ProShares UltraShort S&P500)
U.S. Dollar Index (volatility index)
EEM (iShares MSCI Emerging Markets)
VIX (volatility index)
VXX (iPath S&P 500 VIX Short-Term Futures ETN)
EWG (iShares MSCI Germany Index Fund)
CAT (Caterpillar).
Commentary
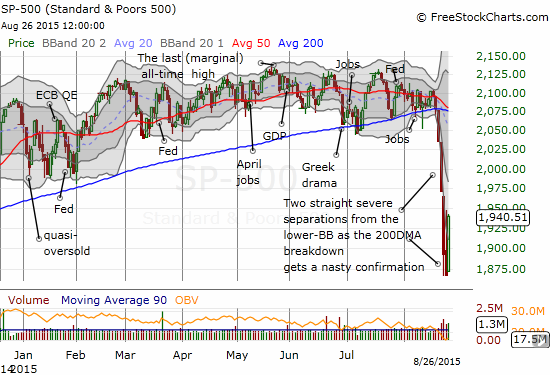
The buyers finally showed up and stood victorious at the close. T2108 rushed upward to 9.7% from 6.1%. (I forgot to note yesterday that T2108 just missed the intra-day low of 5.9% from the historic March, 2009 low!). The S&P 500 (SPY) ended a 6-day losing streak and FINALLY closed above its lower-Bollinger Band (BB) for the first time in 5 days. This produced a 3.9% gain on the index.
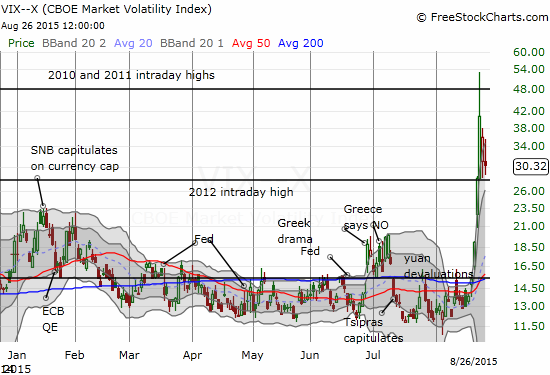
Surprisingly, the volatility index, the VIX, failed to close below the low of the last major upward surge. This bear/bull line just happens to coincide with the intraday high from 2012’s market sell-off.
Why do I think the VIX is still in the dangerzone? Check out these stats from VIX expert Bill Luby:
2nd day in a row that $VIX is down and VIX futures are up $VX_F
— Bill Luby (@VIXandMore) August 26, 2015
So, I had to ask…is the term structure of the VIX in contango (futures at a higher level than current (spot) levels) or in backwardation (futures at a lower level than current (spot) levels)?
@DrDuru $VIX futures in backwardation thru Dec contract, then essentially flat for 2016
— Bill Luby (@VIXandMore) August 26, 2015
Typically, people have more fear about the future than the present because the future is unknown. The current backwardation means there is a LOT more fear about the current day than the future. I culled Bill Luby’s blog The VIX and More for a good post on backwardation. A post from October 21, 2012 titled “The 2012 VIX Futures Term Structure as an Outlier” includes a graph that I reprint below showing the “typical” contango pattern for the VIX. The year 2008 is the only year in the sample at that time to produce significant backwardation.
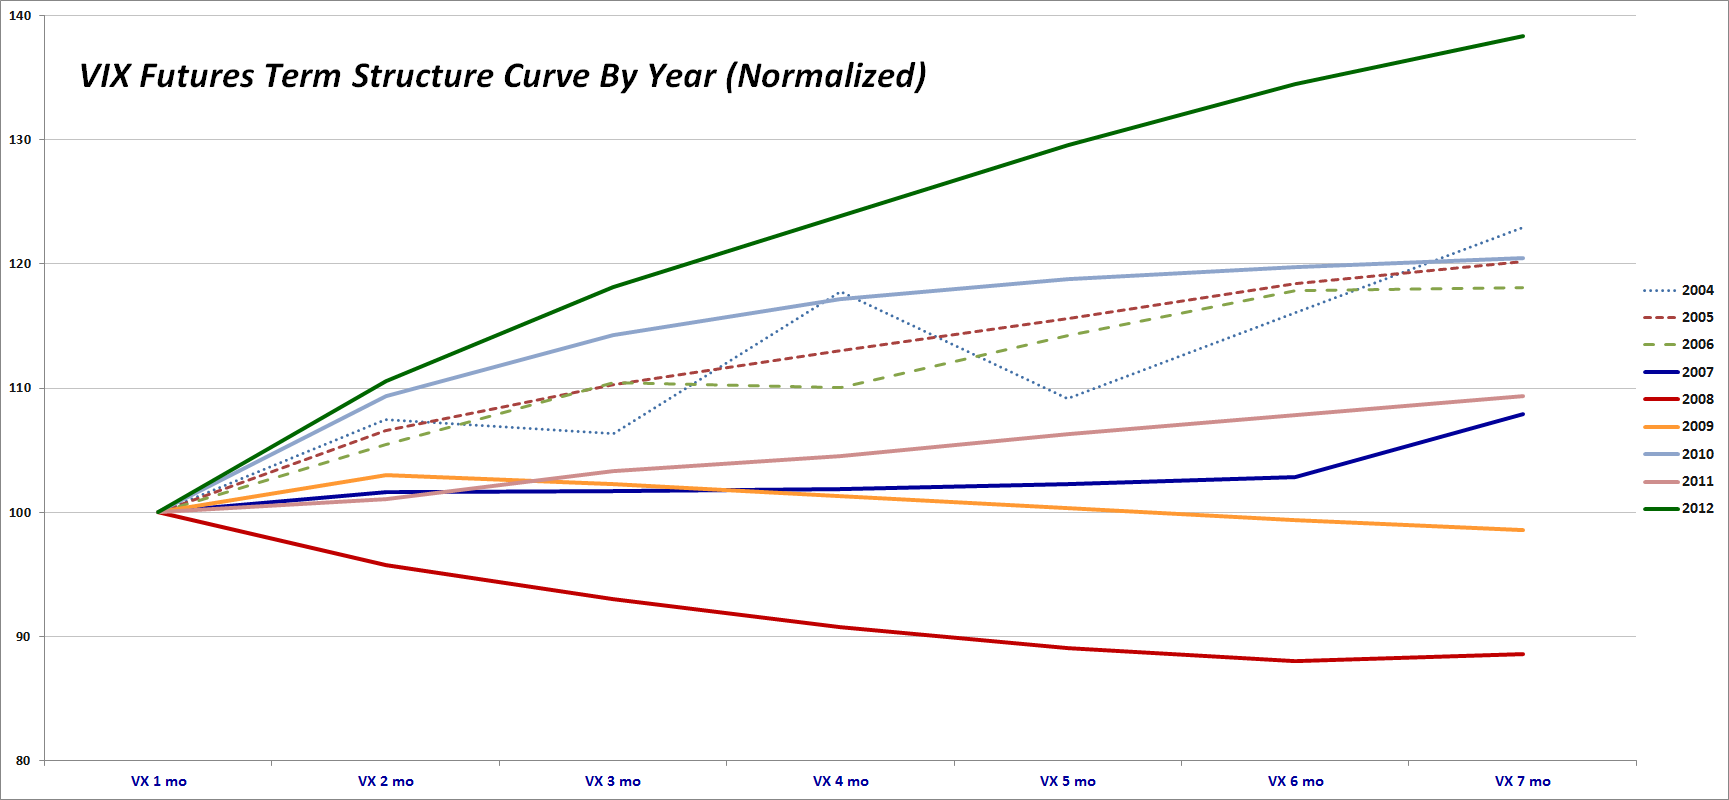
Source: VIX and More
You should read the article for more background. The bottom-line is that while fear about the present is running so much higher than the future, we should expect wild swings in the market as over-sensitized traders and investors react and over-react and respond to every signal. Special reports like the ones CNBC runs every night like an emergency response center likely add an extra element of anxiety. The GOOD news for those with strong stomachs and good risk management: betting AGAINST the current high levels of the VIX will most likely pay off (and pay off well in these particularly extreme days) if you plan out a strategy that you can sustain over the course of weeks (or months if the current panic REALLY gets extreme).
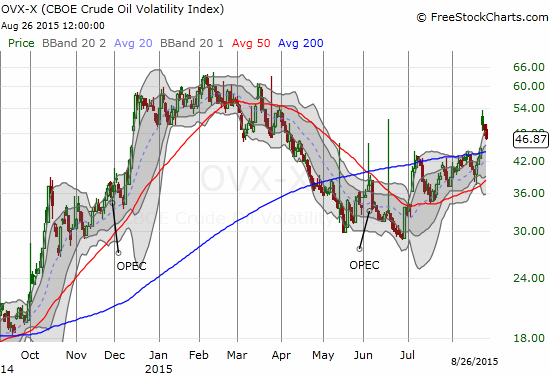
I forgot to note on Monday that the CBOE Crude Oil Volatility Index (OVX) broke out. The rangebound trade I made a month ago on United States Oil (USO) is of course not working out well with volatility soaring like this. However, I am getting ready to make a fresh bet if volatility reaches the earlier highs. My first trade was like dipping my toe in the water. The next one will be the serious bet. Stay tuned.
The Australian dollar (FXA) and Japanese yen (FXY) combination, aka AUD/JPY, threw the market a bone by holding the previous day’s low and making a comeback. This was a small positive, but only a renewed rise gets the market out the dangerzone. A break of the major low from Monday would mark a disastrous breakdown and fresh wave of bearishness. I hope to write another piece soon explaining again why I think of AUD/JPY as such an important tell.
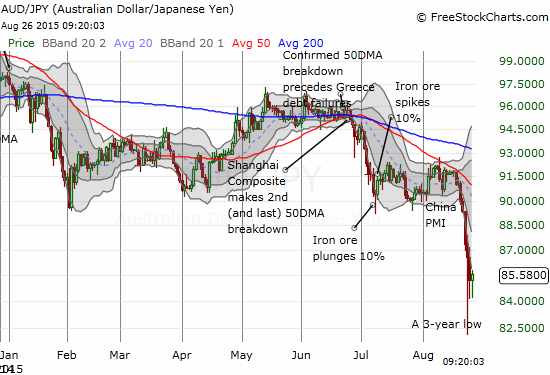
I was watching AUD/JPY when I was asked a question about buying ProShares Short VIX Short-Term Futures (SVXY) on StockTwits.
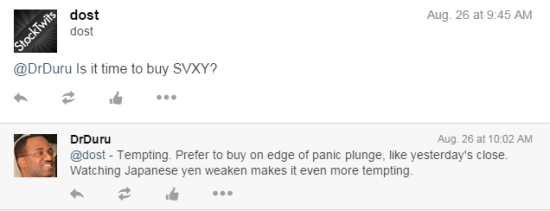
I was hesitant because I sold yesterday’s fortuitous grab of SVXY shares right at the open. SVXY faded from there and even traded under $50 for a spell. It SEEMED like a great moment to get back in. However, my trading rules were ringing in my head, so I left it alone and instead placed a low-ball limit order close to Monday’s low.
As time wore on (I am talking minutes!), I noticed that the Japanese yen was continuing to weaken. I decided to speculate that the strengthening indicated buying returning to the market (in-line with my trading rule on AUD/JPY), so I bought a single put option on ProShares Ultra VIX Short-Term Futures (UVXY). These options are VERY expensive right now, so I do not want to load up on them as I normally would do. As a reminder, I prefer to speculate with options because they automatically limit my downside to a small amount.
Sure enough, the yen continued to weaken, AUD/JPY rose strongly into the close, and I sold the put for a tidy gain. The buying on the market was strong enough for me to lock in a double on my ProShares Ultra S&P500 (SSO) call options that triggered near yesterday’s close.
Going back to the standard T2108 rules, the rangebound VIX did not trigger any fresh trades. I have chosen the aggressive path, so I load up again on T2108 trades if the VIX breaks the high for the current cycle. If this happens, I will try to wait for an additional 5 to 10% rise above recent highs. Less aggressive traders/investors should keep waiting for the low of the last major surge to break. Again, the intraday 2012 high conveniently marks this dividing line.
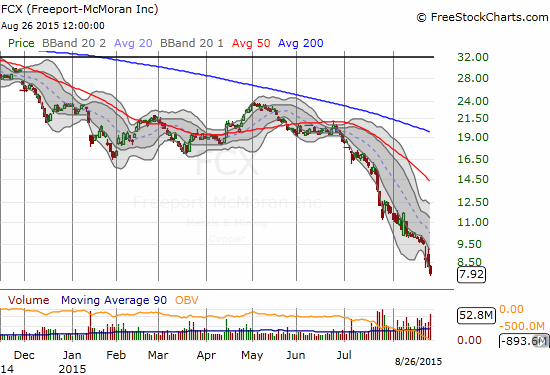
For good measure, I got back into a (small) hedge using Caterpillar (CAT) put options. This move is VERY early. However, with this oversold period now in its fourth day and T2108 still in single digits, I do not want to stay as “naked” as I have been since closing out most of my remaining short positions on Tuesday (August 25th). The relative weakness in copper miner Freeport-McMoRan Inc. (FCX) triggered my interest in CAT puts. FCX closed right at its historic low from late 2008 – a level that was last since in late 2002. Yikes.
Buckle up and brace for more drama!
(In after hours news, Workday (WDAY) managed to disappoint and closed down about 7%. That ruins one of the call options I bought during Friday’s sell-off into oversold conditions.)
Daily T2108 vs the S&P 500
")
Black line: T2108 (measured on the right); Green line: S&P 500 (for comparative purposes)
Red line: T2108 Overbought (70%); Blue line: T2108 Oversold (20%)
Weekly T2108

*All charts created using freestockcharts.com unless otherwise stated
The charts above are the my LATEST updates independent of the date of this given T2108 post. For my latest T2108 post click here.
Related links:
The T2108 Resource Page
Expanded daily chart of T2108 versus the S&P 500
Expanded weekly chart of T2108
Be careful out there!
Full disclosure: long SVXY shares, long SSO shares and call options, long WDAY call options, long UVXY put options, short USO puts, short USO call spread, long CAT put options, long FCX