
(T2108 measures the percentage of stocks trading above their respective 40-day moving averages [DMAs]. It helps to identify extremes in market sentiment that are likely to reverse. To learn more about it, see my T2108 Resource Page. You can follow real-time T2108 commentary on twitter using the #T2108 hashtag. T2108-related trades and other trades are occasionally posted on twitter using the #120trade hashtag. T2107 measures the percentage of stocks trading above their respective 200DMAs)
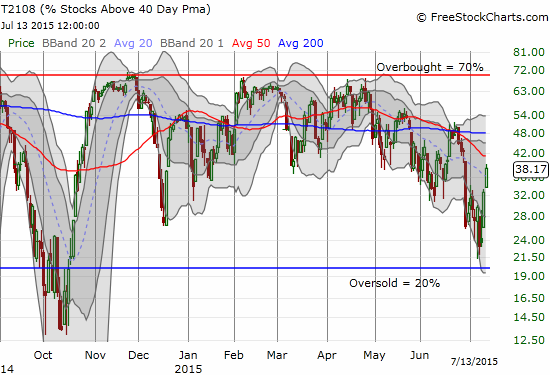
T2108 Status: 38.2%
T2107 Status: 43.0%
VIX Status: 13.9 (a 17.4% plunge)
General (Short-term) Trading Call: Bullish
Active T2108 periods: Day #182 over 20%, Day #2 over 30% (overperiod), Day #9 under 40%, Day #35 under 50%, Day #52 under 60%, Day #251 under 70%
Reference Charts (click for view of last 6 months from Stockcharts.com):
S&P 500 or SPY
SDS (ProShares UltraShort S&P500)
U.S. Dollar Index (volatility index)
EEM (iShares MSCI Emerging Markets)
VIX (volatility index)
VXX (iPath S&P 500 VIX Short-Term Futures ETN)
EWG (iShares MSCI Germany Index Fund)
CAT (Caterpillar).
Commentary
Once again, T2108 delivers in a big way.
First, the “close enough” to oversold conditions trades paid off tremendously with the current rally. Second, and most importantly, volatility has completely imploded just as I had hoped and detailed in my past T2108 Updates. The main asterisk, and perhaps lesson learned, is that I happened to start hedging my anti-volatility trade just as the big payoff was around the corner. It was a classic display that even in following the trading rules, an over-anxious trade finger can reduce returns.
The bullish divergence I pointed out in the last T2108 Update resolved perfectly to the upside. T2108 has now almost reversed all its losses from the start of the latest Greek drama, and the S&P 500 (SPY) has completely reversed those same losses.

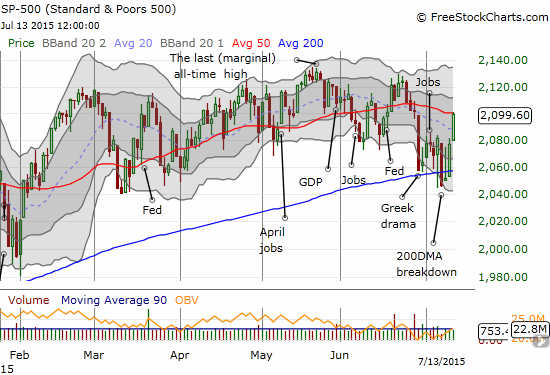
As noted above, the S&P 500 now faces a critical test of resistance. Momentum is on its side, and T2108 still has room to the upside. Either the index just established a firm pair of bookends with recent lows on one end and the 50DMA at the other end OR the “close enough” oversold conditions created the latest springboard out of market angst. I am still betting on the springboard, but I will be wringing my hands again as (if?) the index approaches its all-time highs: for example, I am still warily eyeing the market drama in China. (Note that I never did purchase call options on ProShares Ultra S&P500 (SSO) since T2108 did not drop into oversold territory. I am instead sticking with the anti-volatility trade).
Note that I am not calling T2108’s lag on recovering the losses from the latest round of Greek drama a bearish divergence. Such a label would only apply, for example, if T2108 were oversold or near such conditions where it made sense to bias bearish. Of course, granted, the S&P 500 converging with 2100 AND a declining 50DMA has to look VERY tempting to eager bears…
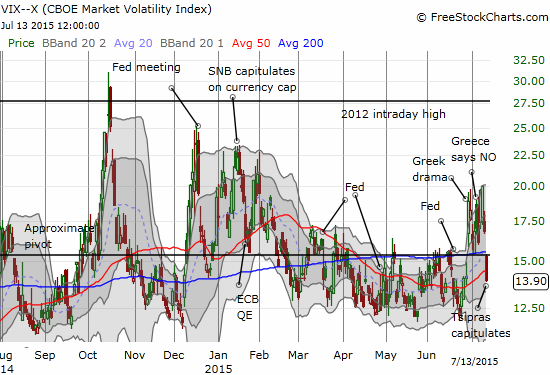
The VIX has officially imploded. It trades once again below the crucial 15.35 pivot line. The volatility index now trades below where it started just ahead of the explosion of the Greek drama. I am assuming it has at least a little more downside from here as I keep the anti-volatility trade on just-a-little-longer.
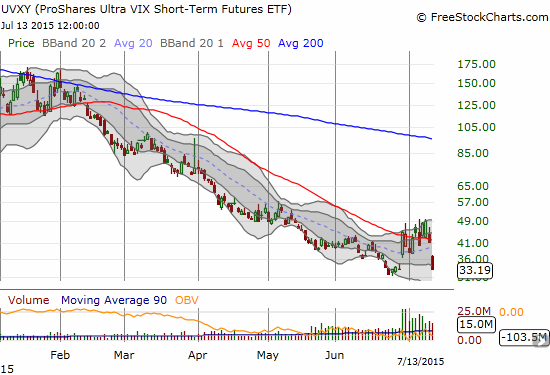
Curiously, the volatility products did not keep pace with the decline in the VIX. For example, ProShares Ultra VIX Short-Term Futures (UVXY) “only” declined 20% even though it is supposed to perform 2x the performance of the VIX. I am assuming more of the expected decline is right around the corner as long as the S&P 500 does not turn on a dime at resistance with a steep decline.
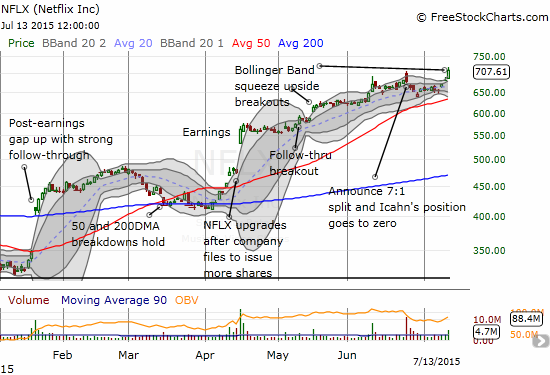
One of the most attractive charts of the day came from Netflix (NFLX). Icahn’s exit threw me off my bullish strategy. Today’s new all-time high gets me back in the game. However, earnings are coming Wednesday, so I am staying on hold until I see how the market reacts.
Finally, the Australian dollar (FXA) has reached some stability with the Japanese yen (FXY). AUD/JPY stalled out enough for me to gain more confidence in the anti-volatility trade at this juncture. Again, I am monitoring this frequent correlate of risk aversion much more closely as the market works through the current angst.
(Quick addendum: today I went back to another market hedge by buying August put options on Caterpillar (CAT)).
Daily T2108 vs the S&P 500
")
Black line: T2108 (measured on the right); Green line: S&P 500 (for comparative purposes)
Red line: T2108 Overbought (70%); Blue line: T2108 Oversold (20%)
Weekly T2108

*All charts created using freestockcharts.com unless otherwise stated
The charts above are the my LATEST updates independent of the date of this given T2108 post. For my latest T2108 post click here.
Related links:
The T2108 Resource Page
Expanded daily chart of T2108 versus the S&P 500
Expanded weekly chart of T2108
Be careful out there!
Full disclosure: short AUD/JPY, long UVXY put options and shares, long CAT put options