
(T2108 measures the percentage of stocks trading above their respective 40-day moving averages [DMAs]. It helps to identify extremes in market sentiment that are likely to reverse. To learn more about it, see my T2108 Resource Page. You can follow real-time T2108 commentary on twitter using the #T2108 hashtag. T2108-related trades and other trades are occasionally posted on twitter using the #120trade hashtag. T2107 measures the percentage of stocks trading above their respective 200DMAs)
T2108 Status: 48.8%
T2107 Status: 51.7%
VIX Status: 12.9 (down 15%)
General (Short-term) Trading Call: Neutral.
Active T2108 periods: Day #139 over 20%, Day #98 above 30%, Day #42 above 40% (overperiod), Day #4 under 50% (underperiod), Day #8 under 60%, Day #208 under 70%
Reference Charts (click for view of last 6 months from Stockcharts.com):
S&P 500 or SPY
SDS (ProShares UltraShort S&P500)
U.S. Dollar Index (volatility index)
EEM (iShares MSCI Emerging Markets)
VIX (volatility index)
VXX (iPath S&P 500 VIX Short-Term Futures ETN)
EWG (iShares MSCI Germany Index Fund)
CAT (Caterpillar).
Commentary
The S&P 500 (SPY) is up 2.8% year-to-date….exactly twice the gain of 1.4% achieved on Friday. No wonder market observers can still generate excitement on a big rally day that rests firmly within an on-going chopfest.
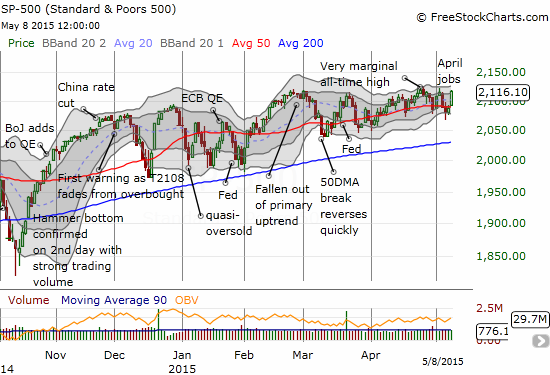
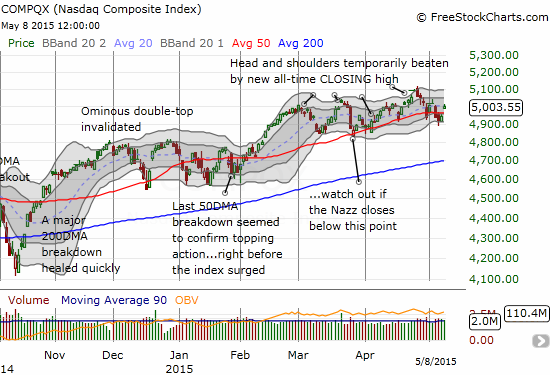
The NASDAQ is also following along its 50DMA and spending a little more time above support than below.
T2108 is still lagging the S&P 500. The last bout of churn took T2108 as low as 38% last week. It closed Friday at 48.9%. This level means the market has plenty of upside potential. Yet, if previous patterns from this chopfest hold, the S&P 500 will barely scratch out a new marginal all-time high before proceeding to chop its way back to the bottom of its narrow trading (upwardly biased) channel.
Friday’s strong surge took out volatility with a body blow. The VIX plunged by 15% as it hurtled toward its recent lows.
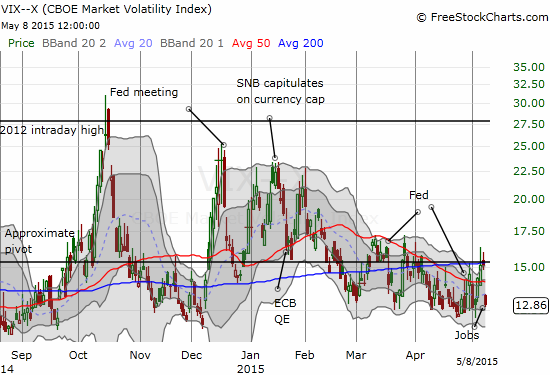
I had no reason to expect such a dramatic move in the wake of Friday’s employment report, so I had no volatility trade on. Now, the trade is to go long volatility again. I will wait until the S&P 500 makes a little more headway toward or into a new all-time high.
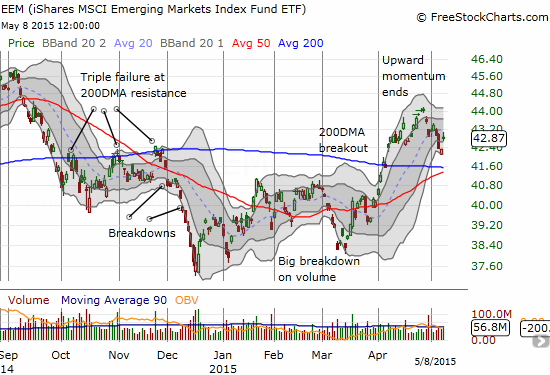
The last trade I mentioned was a hedged play on iShares MSCI Emerging Markets (EEM). It worked out even better than I could have hoped as the gains were nearly immediate. A large plunge on Wednesday was followed by mild follow-through on Thursday. I set a stop to protect profits on my very large put position. The market saw fit to take out that stop with a quickness as EEM forged a bottom for the day. That stop became a savior as EEM gapped right back up on Friday. EEM at one point had reversed all its losses from the previous two days and almost brought the call option side of the hedge back to even. I will now ride these calls as long as I can given my profits from the puts have paid for them (and much more).
There are plenty more telling charts featuring their own trading opportunities. With earnings season largely behind us, it is a little “safer” to make moves now…especially moves that take advantage of post-earnings momentum.
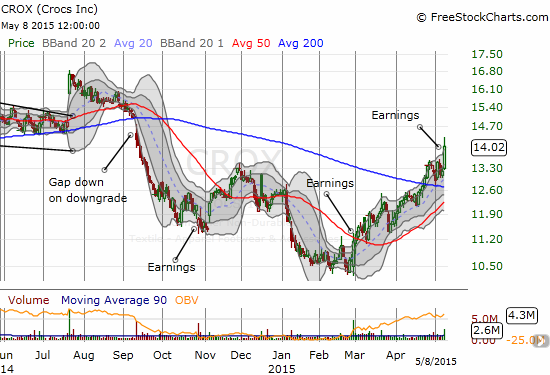
Crocs, Inc. (CROX)
CROX surged on double its average trading volume in reaction to earnings. I have pointed out bullish patterns for CROX in the past; the last one eventually failed. Friday’s reaction is a strong, confirming follow-through to a surge from the previous earnings report. I wish I had been paying attention at that time because that move led to a very buyable 50DMA breakout. The subsequent upward trend channel remains well intact.
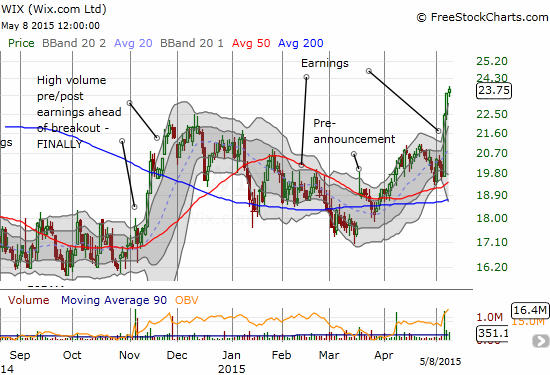
Wix.com Ltd. (WIX)
Speaking of missed opportunities, WIX is bursting out the gate and confirming bullishness from last year. I bailed on my position after momentum appeared to end. It looked like a timely move as WIX broke below its 200DMA in March. I took my eye off the ball and completely missed a nice comeback with a pre-announcement that took the stock above its 50DMA. The buy point came upon the second 50DMA breakout. WIX is now up three days straight on strong buying volume. It is above its upper-Bollinger Band and should pull back in the coming week or so. I am looking to buy the dips!
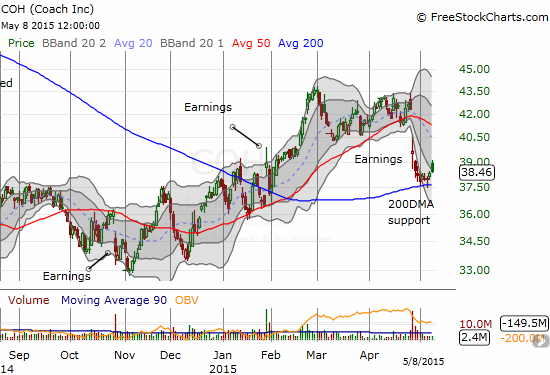
Coach, Inc. (COH)
COH is back to experiencing rough times. Its 200DMA has slowed down a post-earnings plunge. I am positioned assuming this support will hold and lead eventually to a test of resistance at the 50DMA.
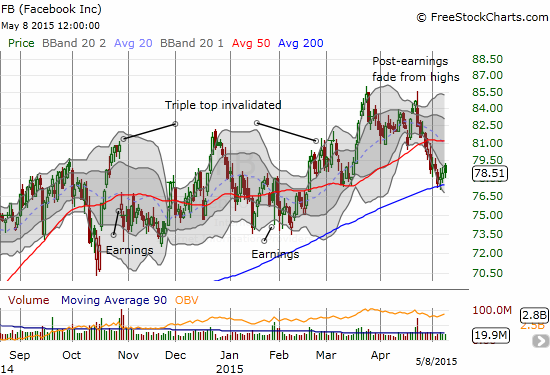
Facebook (FB)
FB has recently found post-earnings support at its 200DMA but its descent to this level has been very bearish. After a swift post-earnings fade, FB sold off almost every single day on its way to support. It now trades below the previous triple top and has a LOT to prove again.
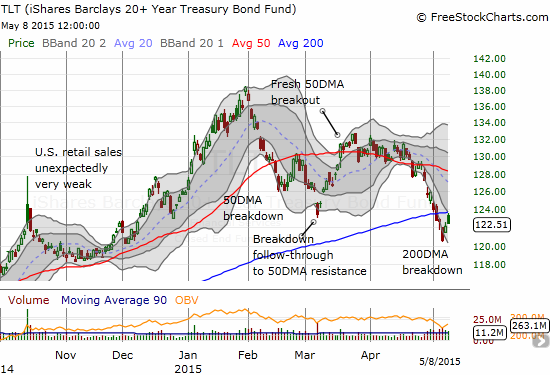
iShares 20+ Year Treasury Bond (TLT)
All eyes are on global bond markets. The U.S. dollar has been weakening while rates rise – a hint of inflation fear in the air. TLT got over-extended to the downside this past week, and I jumped in with a call spread. I moved to sell on Friday’s extension of the subsequent bounce. I could not get my price so I am hanging on for now. My current target is a retest of 50DMA resistance.
I know rates SHOULD be soaring higher, esp with commodities running up, but $TLT now looks over-extended ST. Playing a bounce.
— Dr. Duru (@DrDuru) May 6, 2015
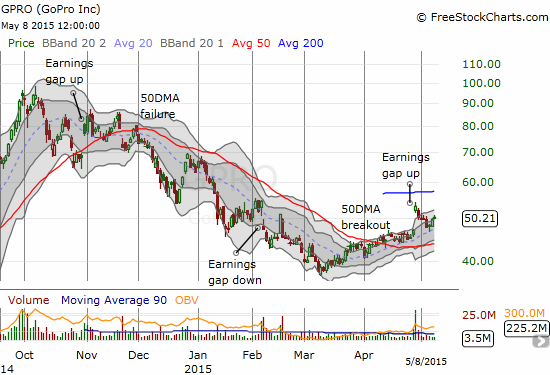
GoPro, Inc. (GPRO)
GPRO has been much maligned given its extremely high valuation and a product that sure seems vulnerable to eventual competition and commoditization. However, GPRO has experienced a nice uptrend from March lows. The gap up from earnings seemed to confirm the new momentum. The gap was quickly filled but a hammer pattern that ended right at the upward trending 20DMA seems to have provided support. GPRO is a strong buy with a stop below the post-earnings low. Even after that, I strongly suspect the 50DMA will provide even firmer support.
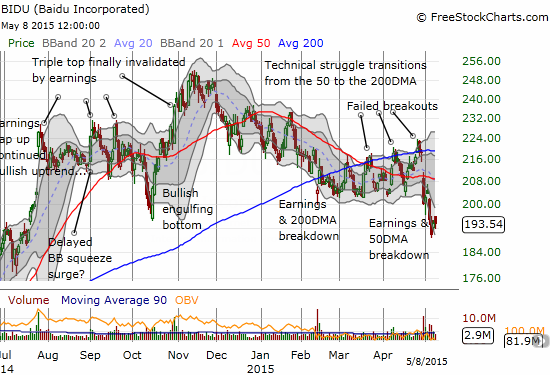
Baidu, Inc. (BIDU)
For a brief moment before earnings, BIDU looked like it was finally ready to break out of its downward channel and resume its upward momentum. Earnings ended those hopes quickly. The subsequent breakdown has sent the stock to the bottom of the previous downward channel and a new 10-month low. The progression is slow and choppy, but BIDU now has all the technical markers of a breakdown underway. I tried to play a bounce last week, and I was soundly rejected. I am now much more inclined to fade rallies on BIDU.
Daily T2108 vs the S&P 500
")
Black line: T2108 (measured on the right); Green line: S&P 500 (for comparative purposes)
Red line: T2108 Overbought (70%); Blue line: T2108 Oversold (20%)
Weekly T2108

*All charts created using freestockcharts.com unless otherwise stated
The T2108 Resource Page
Expanded daily chart of T2108 versus the S&P 500
Expanded weekly chart of T2108
Be careful out there!
Full disclosure: long EEM calls, long COH calls, short FB shares and long FB calls,