
(T2108 measures the percentage of stocks trading above their respective 40-day moving averages [DMAs]. It helps to identify extremes in market sentiment that are likely to reverse. To learn more about it, see my T2108 Resource Page. You can follow real-time T2108 commentary on twitter using the #T2108 hashtag. T2108-related trades and other trades are occasionally posted on twitter using the #120trade hashtag. T2107 measures the percentage of stocks trading above their respective 200DMAs)
T2108 Status: 49.1%
T2107 Status: 47.9%
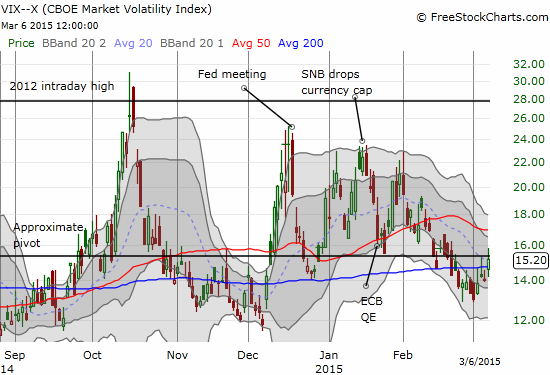
VIX Status: 15.2 (faded from highs again to close below the pivot point)
General (Short-term) Trading Call: Bearish given S&P 500 close below 2085. Staying bearish until new all-time high or oversold.
Active T2108 periods: Day #95 over 20%, Day #54 above 30%, Day #34 over 40% (overperiod), Day #1 under 50% (underperiod) (ending 23 days over 50%, and 15 days over 60%), Day #1 under 60%, Day #165 under 70%
Reference Charts (click for view of last 6 months from Stockcharts.com):
S&P 500 or SPY
SDS (ProShares UltraShort S&P500)
U.S. Dollar Index (volatility index)
EEM (iShares MSCI Emerging Markets)
VIX (volatility index)
VXX (iPath S&P 500 VIX Short-Term Futures ETN)
EWG (iShares MSCI Germany Index Fund)
CAT (Caterpillar).
Commentary
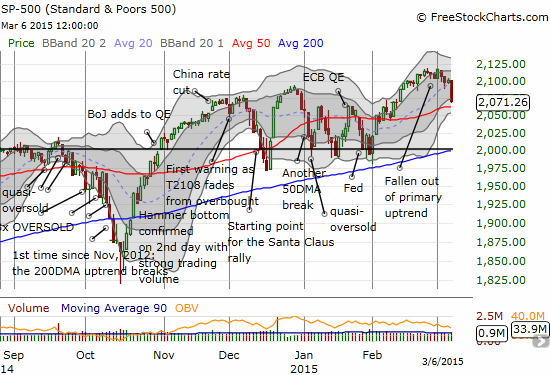
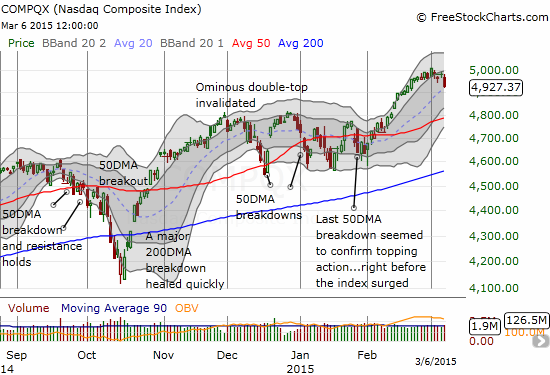
The date was February 3rd when T2108 skipped an entire 10 percentage point range going from 49.1% to 62.2%. The move was so powerful that I began to expect the beginnings of an extended overbought rally. Instead, T2108 made no more progress, and the S&P 500 (SPY) trickled ever higher making one half-spirited all-time high after another. Instead of an extended overbought rally, we got an extended waiting period over during which T2108’s behavior kept me from changing the bearish trading bias.
The date was January 5th when T2108 skipped an entire 10 percentage point range going from 50.6% to 38.8%. At the time, the S&P 500 broke down below its 50DMA for the second time in 3 months. I supplied a bevy of bearish individual stock charts. I prepared for an S&P 500 retest of 200DMA support and oversold conditions. Instead, the index sold off just one more day before continuing along its chopping range for another 5 weeks. That chop included two days where the S&P 500 made fresh marginal closing and intraday lows for 2015.
I provide this context because T2108 has made another dramatic move. T2108 skipped right through the 50s again but this time to the downside, moving from 60.3% to 49.1%. This is a very bearish move, but the recent history prevents me from over-extending the bearish implications of the drop. Friday’s move could be yet another prelude to a quick change in direction for the S&P 500, especially with 50DMA support close at hand.
Nevertheless, the index closed below my bearish dividing line of 2085, so I am sticking to my earlier stated rule. Over the last few days, I have been firmer in my warnings because T2108 absolutely refused to respond to the S&P 500’s sluggish creep higher. Today’s 1.4% drop on the S&P 500 provided convincing follow-through to those warning signs.
The index and T2108 are now singing the same bearish tune. The index definitively closed below my 2085 dividing line for changing my trading call from mildly bearish to bearish. I did not buy any put options on ProShares Ultra S&P500 (SSO) because I wanted to wait for a confirmed close. In fact, I sold my put options on Caterpillar (CAT) as the stock broke down below $80 for the second time during the day. The stock traded below its lower-Bollinger Band (BB) for the third day in a row, so I think it could bounce sharply at any moment. Moreover, the post-earnings low is barely a point away. Since my CAT put options are a hedge on SPY bullishness, I no longer need to hold them as I turn outright bearish – there are many other better targets out there with a lot more downside risk.
With my last batch of call options on ProShares Ultra VIX Short-Term Futures (UVXY) expiring on the day, I bought a fresh round near the day’s open. It was a timely purchase, and I decided to hold them given the bearish move on the S&P 500. I will likely lock in profits on the next move downward and prepare to focus on SSO positioning. The volatility index, the VIX, surprisingly faded into the close even as the S&P 500 closed on its low of the day. In other words, the bears have not yet won any important victories from the technical perspective.
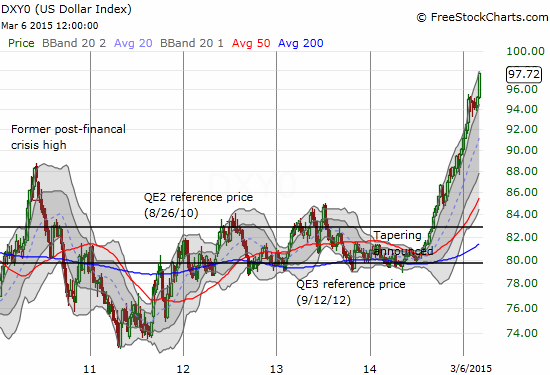
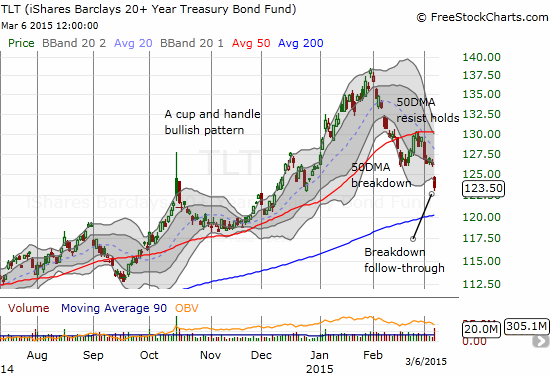
The headline angst for the stock market was a “surprisingly” strong jobs report. Apparently, this good news was bad news for the market as the odds for a Fed rate hike increased for June. This in turn sent the U.S. dollar (UUP) much higher on the day and bond yields higher. The weekly chart shows just how strong the U.S. dollar has become as it neatly follows a sharp angle higher. On the daily chart, the dollar index has extended far about its upper-BB. The iShares 20+ Year Treasury Bond (TLT) has gone from a bullish cup and handle pattern to a very bearish, confirmed breakdown of the 50DMA. The 50DMA has gone from support to resistance. My play on support is obviously over; I have turned my gaze to rate sensitive plays (excluding home builders!).
As a reminder, March is one the “safest” months as far as average drawdowns, but it is one of the most dangerous months in terms of maximum drawdown. Hopefully this month’s drawdown will come with oversold conditions…but one step at a time.
Daily T2108 vs the S&P 500
")
Black line: T2108 (measured on the right); Green line: S&P 500 (for comparative purposes)
Red line: T2108 Overbought (70%); Blue line: T2108 Oversold (20%)
Weekly T2108

*All charts created using freestockcharts.com unless otherwise stated
The T2108 Resource Page
Expanded daily chart of T2108 versus the S&P 500
Expanded weekly chart of T2108
Be careful out there!
Full disclosure: long UVXY call options, net long the U.S. dollar