
(T2108 measures the percentage of stocks trading above their respective 40-day moving averages [DMAs]. It helps to identify extremes in market sentiment that are likely to reverse. To learn more about it, see my T2108 Resource Page. You can follow real-time T2108 commentary on twitter using the #T2108 hashtag. T2108-related trades and other trades are occasionally posted on twitter using the #120trade hashtag. T2107 measures the percentage of stocks trading above their respective 200DMAs)
T2108 Status: 60.9%
T2107 Status: 52.0%
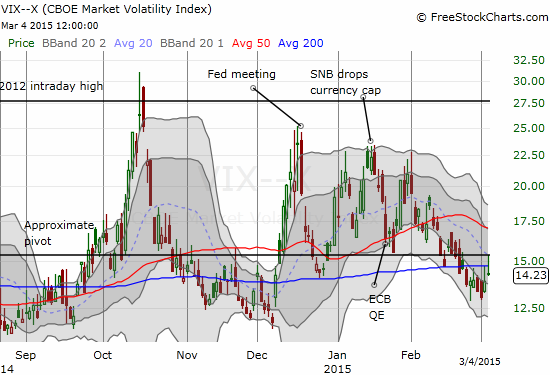
VIX Status: 14.2 (faded from a high of 15.33, right at the VIX pivot point)
General (Short-term) Trading Call: Mildly bearish – STILL waiting to see what happens when/if T2108 becomes overbought. Solidly bearish on a S&P 500 close below 2085.
Active T2108 periods: Day #93 over 20%, Day #52 above 30%, Day #32 over 40%, Day #14 over 60% (overperiod), Day #163 under 70%
Reference Charts (click for view of last 6 months from Stockcharts.com):
S&P 500 or SPY
SDS (ProShares UltraShort S&P500)
U.S. Dollar Index (volatility index)
EEM (iShares MSCI Emerging Markets)
VIX (volatility index)
VXX (iPath S&P 500 VIX Short-Term Futures ETN)
EWG (iShares MSCI Germany Index Fund)
CAT (Caterpillar).
Commentary
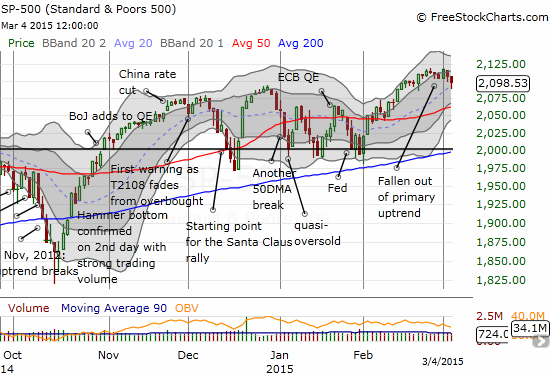
T2108 has spent 14 trading days (three calendar weeks) casually hanging out between 60 and 70% (overbought). Since the tease with overbought levels in early February, T2108 has not traded higher than 66%. Today, T2108 finally behaved slightly differently by actually trading below 60% before closing at 60.9%. This looks like small confirmation of the waning momentum I have pointed out as the S&P 500 (SPY) has managed to trade to marginal new all-time highs without dragging T2108 higher with it.
The S&P 500 also closed lower. It managed to bounce off its lows right at 2087, my former bear dividing line (now nudged ever so lower to 2085).
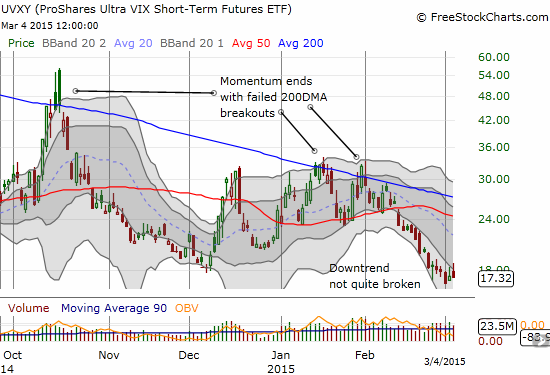
The market looked worse with the volatility index, the VIX, shooting higher after the open. As luck would have it, momentum ended abruptly right at the 15.35 pivot point (imagine that). The subsequent fade also erased a nice gain I had on the day from the call options on ProShares Ultra VIX Short-Term Futures (UVXY) I bought last week.
It is subtle, and barely perceptible, but the market seems set up for some nice tension ahead of this Friday’s jobs report. I am looking forward to some resolution on this long-standing holding pattern (for T2108 trades).
In the meantime, there has been some very interesting follow-through to charts I have posted in previous T2108 Updates.
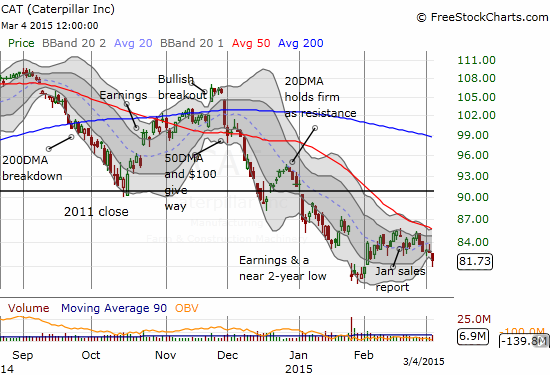
Caterpillar (CAT)
The post January sales report selling has resumed. A retest of January’s post-earnings low now seems in play.
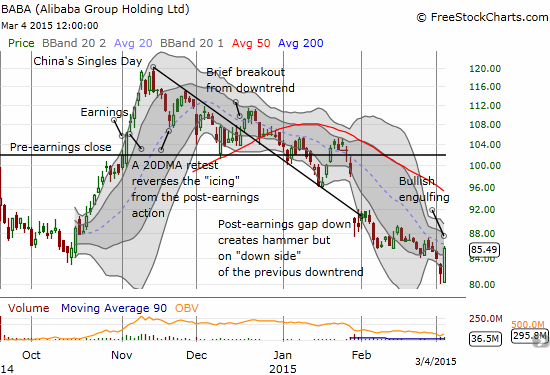
Alibaba Group Holding Limited (BABA)
BABA has been a major disappointment since the peak it formed on China’s Singles Day with just a few respites from the on-going downtrend. The excitement around that event has formed a classic blow-off top. The downtrend that ensued has now created a pivot line for the stock. A break of $80 seemed all but certain until buyers finally showed up in force today. While the downtrend is far from broken, the bullish engulfing pattern may have started a classic bottoming pattern. The next hurdle will likely be whatever lock-up period(s) is coming for insiders to unload shares onto the market.
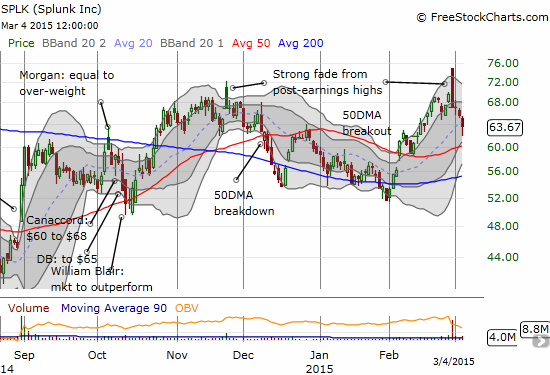
Splunk (SPLK)
The post-earnings fade continues. While I was late to the party, I did catch the last three days of selling. I locked up profits as the stock got “close enough” to its 50DMA. I am fully aware that the stock could turn around on a dime at anytime.
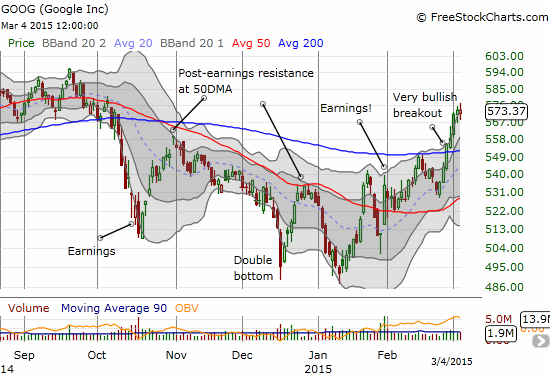
Google (GOOG)
The breakout continues as GOOG has moved into “full bull” position. The stock has not even come close to providing a pullback I can comfortably buy. Now I will be happy to buy at the bottom of the uptrend channel formed by the two upper-Bollinger Bands (BB).
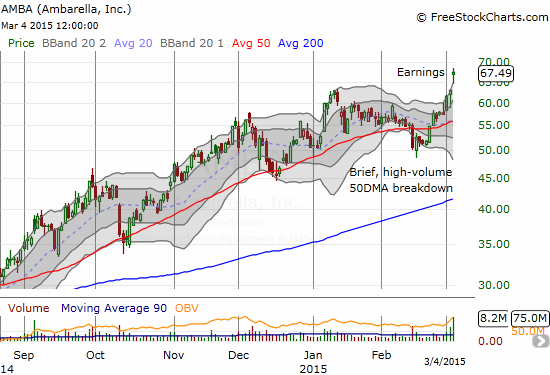
Ambarella, Inc. (AMBA)
When AMBA broke down below its 50DMA, the high selling volume seemed to confirm the beginning of “the end.” Instead, the stock sharply rebounded the very next day and has essentially not looked back since. The buyers made a point by recovering the stock quickly above its 50DMA. I did not even think to check on the next earnings date. With the 7% post-earnings pop, I daresay that the earlier breakdown likely featured an important exit of a good number of “weak hands” in AMBA. Buyers should stay in firm control for a while. A filling of the post-earnings gap up would start to reverse the bullish outlook.
Intercept Pharmaceuticals, Inc. (ICPT)
“I have written several times about trades on ICPT. My last trade setup was a hedged one going short shares and long call options. I was actually expecting a pullback after the stock offering but instead ICPT has surged well past its $176 offering price. I am thoroughly impressed with the resilience even with these extremely low trading volumes. If the stock manages to breakout above its 200DMA, I will have to assume a fill of the November earnings gap down is in play. I am watching volume closely under the assumption that the next volume surge will point the direction for the next sustained move.”
This quote was from my last post on ICPT. Today, the stock soared on about twice its average volume. ICPT has now more than filled the November gap down as an impressive breakout from 200DMA resistance continues. The bulls and buyers are in full control again on ICPT. According to briefing.com, M&A rumors were a big driver of today’s excitement: “Intercept Pharma up ~6% today, strength being attributed to earlier reports of interest in French drug maker Genfit among large drug makers.” I suppose these rumors get credence because of ICPT’s recent stock offering. However, I find such a rumor a bit strange given ICPT likely needs to focus its resources on developing its own drug. Even stranger that the stock would rally on such news. Given I have a hedged position, I am simply in favor of any catalyst that moves the stock swiftly and strongly in one direction.

Daily T2108 vs the S&P 500
")
Black line: T2108 (measured on the right); Green line: S&P 500 (for comparative purposes)
Red line: T2108 Overbought (70%); Blue line: T2108 Oversold (20%)
Weekly T2108

*All charts created using freestockcharts.com unless otherwise stated
The T2108 Resource Page
Expanded daily chart of T2108 versus the S&P 500
Expanded weekly chart of T2108
Be careful out there!
Full disclosure: long ICPT call options and short shares; long CAT put options, long BABA shares and put options, long UVXY put options